Are you paying for innovation or simply subsidizing your cloud provider’s electricity bill? With 91% of enterprises admitting they waste roughly 32% of their cloud budget, mastering FinOps metrics is no longer optional – it is a survival requirement for any modern business.
The foundation of AWS unit economics
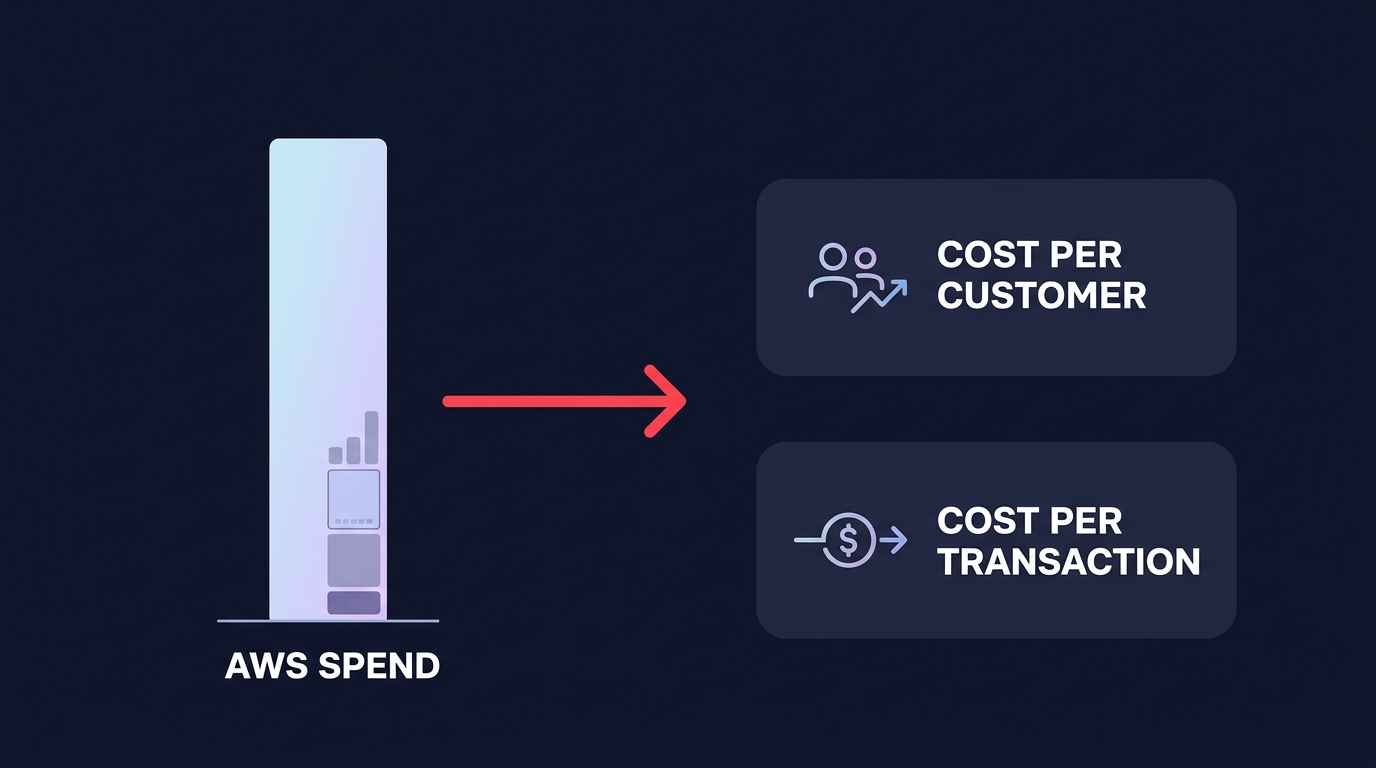
Technical metrics often fail to move the needle in the boardroom because they lack business context. To bridge the gap between engineering and finance, you must translate raw AWS spend into business value using unit economics. This approach separates healthy growth from scaling inefficiency by tying cloud costs directly to revenue-generating activities.
One of the most critical measurements is cost per customer, which tracks how well your infrastructure scales as your user base grows. If this number rises alongside your customer count, your architecture may be getting less efficient over time. Similarly, tracking the cost per transaction – such as API calls, orders, or processed records – provides a granular view of how cloud spend impacts your gross margin. By correlating your AWS Cost Explorer data with these business metrics, you can quickly identify if a spend spike is a sign of success or an underlying technical error.
Resource efficiency and utilization metrics
Cloud waste usually hides in plain sight, often because resources are provisioned for peak loads that never materialize. Most AWS environments operate at an average CPU utilization of only 30-40%, which means you are essentially paying for capacity that sits idle most of the day.
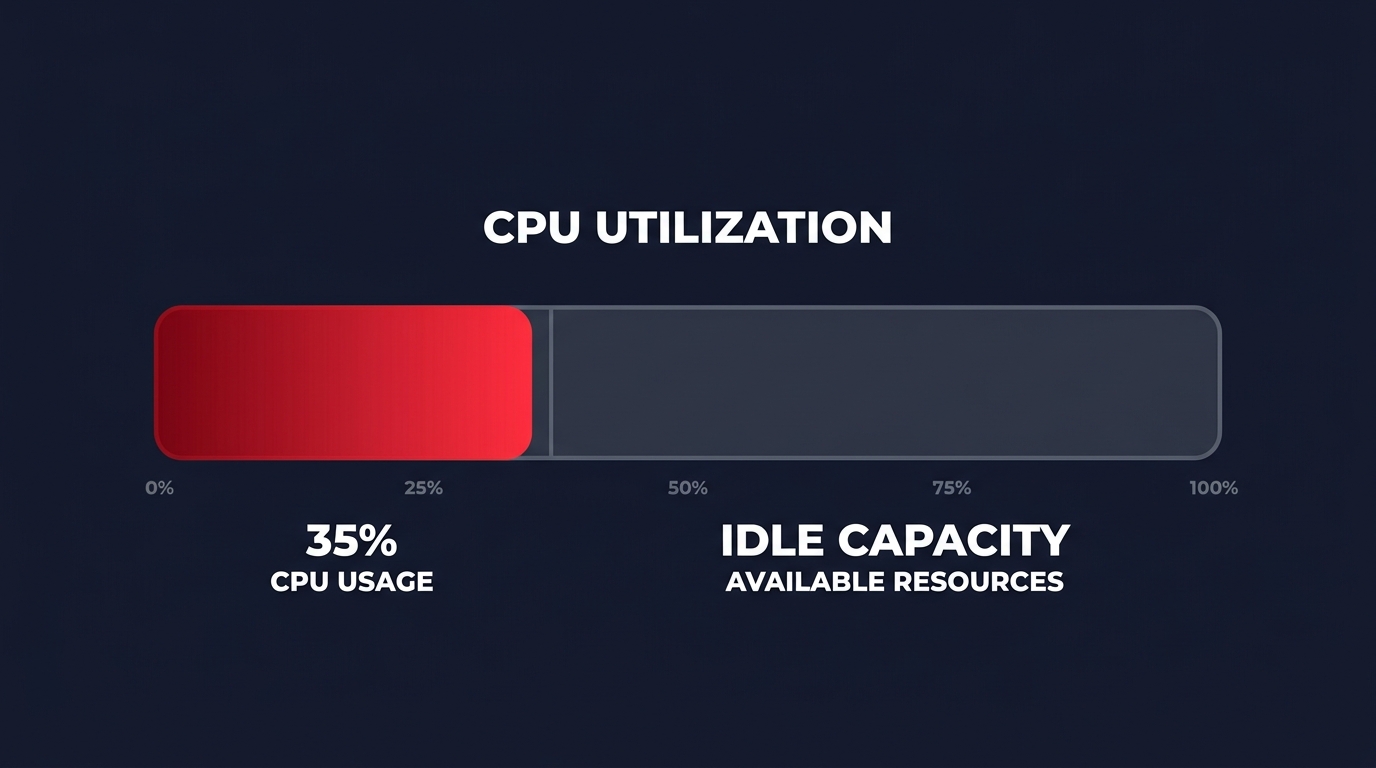
- Utilization rate measures the percentage of purchased capacity actively used. For EC2 instances, consistently low CPU usage – often under 20% – identifies prime candidates for right-sizing.
- Waste percentage tracks the portion of your bill spent on “zombie” resources, such as orphaned EBS volumes, unattached Elastic IPs, or idle load balancers that no longer serve a purpose.
- Storage efficiency evaluates the ratio of data in high-performance tiers versus lower-cost tiers like S3 Glacier. Moving from gp2 to gp3 volumes is a common cost management best practice that can provide immediate monthly savings.
Rate optimization and commitment KPIs
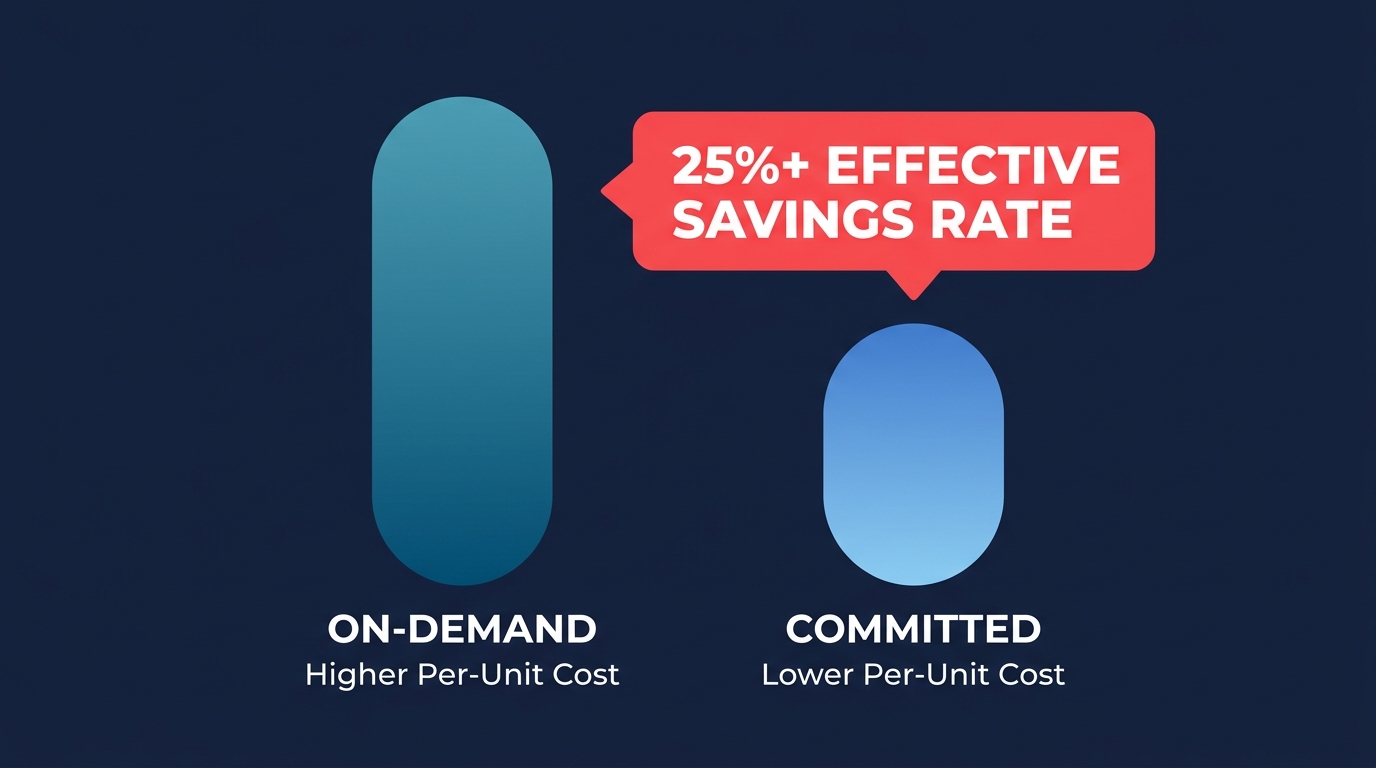
While utilization measures how much you use, rate optimization measures how much you pay for it. Mature FinOps teams move away from On-Demand pricing to maximize the discounts provided by AWS for long-term predictability. The “north star” metric for rate optimization is the Effective Savings Rate (ESR), which calculates the true percentage reduction you achieve versus standard prices. Top-performing teams consistently achieve an ESR of 25% or higher.
Achieving a high ESR requires managing commitment coverage, which is the percentage of your total footprint covered by Savings Plans or Reserved Instances (RIs). For steady workloads, you should aim for a coverage rate between 75% and 90%. However, high coverage must be balanced with commitment utilization to ensure you are not over-committing. Anything below an 80% utilization rate on your purchased discounts suggests you are losing money on the discount itself by paying for reserved capacity you aren’t actually using.
Governance and visibility benchmarks
Effective FinOps requires high-quality data and accountability. If your resources are not labeled correctly, you cannot hold specific teams or departments responsible for their spend. Maintaining high tagging hygiene is the first step toward achieving showback and chargeback, where you aim for at least 95% of resources to have mandatory cost allocation tags.
Governance also involves forecast accuracy. While organizations in the “crawl” stage might experience a 20% variance between predicted and actual spend, mature organizations target a variance of ±5% to ensure budget predictability. To maintain this level of precision, you need real-time observability to reduce the time to detect and resolve anomalies. Identifying a cost spike within hours rather than days prevents minor leaks from becoming five-figure surprises at the end of the billing cycle.
Benchmarking your performance
Knowing your numbers is the first step, but comparing them to industry standards provides the necessary context for optimization. Organizations that track these metrics consistently find that they can move from a reactive state to a “run” stage where efficiency is baked into the development lifecycle.
- Compute utilization should target 65-75% for optimized workloads, compared to the industry average of 30-40%.
- Cloud waste should be kept below 10%, a significant improvement over the typical 32% waste seen in unmanaged environments.
- RI and Savings Plan coverage should reach 90% or higher for mature organizations, ensuring maximum rate discounts.
- Budget variance should be narrowed to ±5% to ensure financial stability and executive trust.
Tracking these KPIs manually is an uphill battle that often requires significant engineering effort. Hykell automates this process by performing continuous cost audits and implementing optimizations on autopilot. By managing your performance monitoring and rate strategies simultaneously, you can reduce your AWS bill by up to 40% without sacrificing speed or reliability. Use the AWS cost savings calculator to uncover your organization’s optimization potential in minutes.