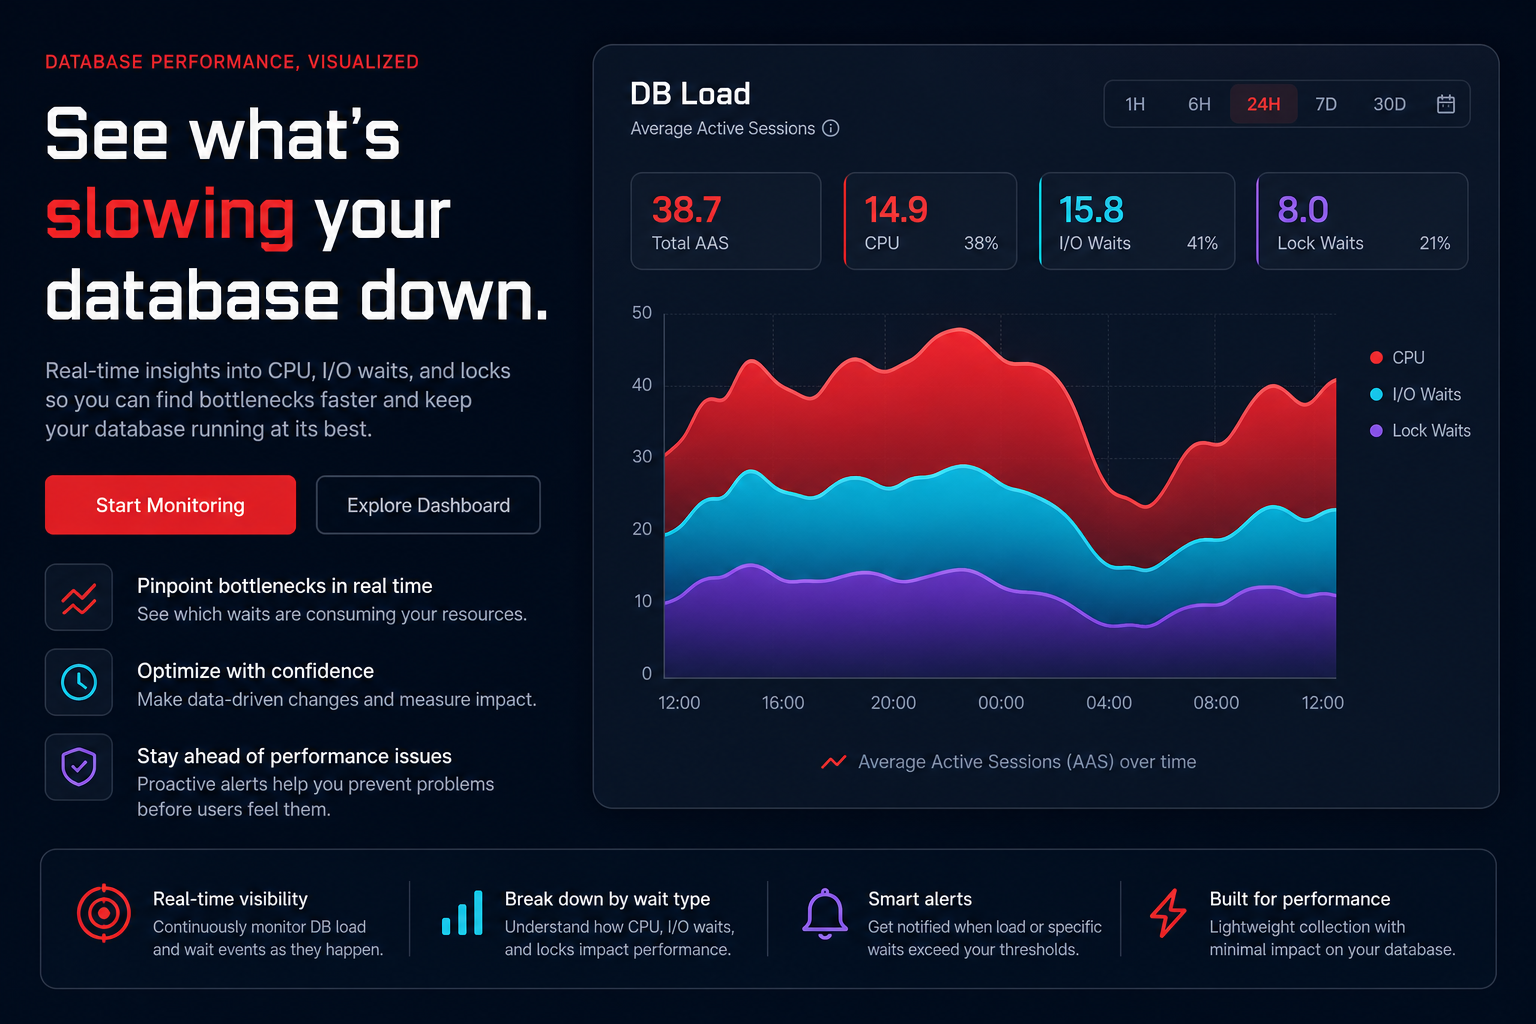
Is your database the silent killer of your application performance? While Amazon RDS simplifies management, troubleshooting a sudden spike in latency often feels like searching for a needle in a haystack – unless you are leveraging Performance Insights to visualize exactly where your queries are stalling.
Amazon RDS Performance Insights is a specialized monitoring feature designed to help you quickly assess database load and determine when and where to take action. Unlike traditional metrics that only show resource utilization, this tool focuses on “DB Load,” which measures how much time your application is spending in the database.
How Performance Insights measures database health
The core metric behind Performance Insights is Average Active Sessions (AAS). This represents the level of session activity in the database, collected every second. When you view your dashboard, you are seeing a visualization of whether your sessions are actively running on the CPU or waiting on specific events, such as I/O or locking. Every active database session contributing to this load is either executing work or impeded by a bottleneck.
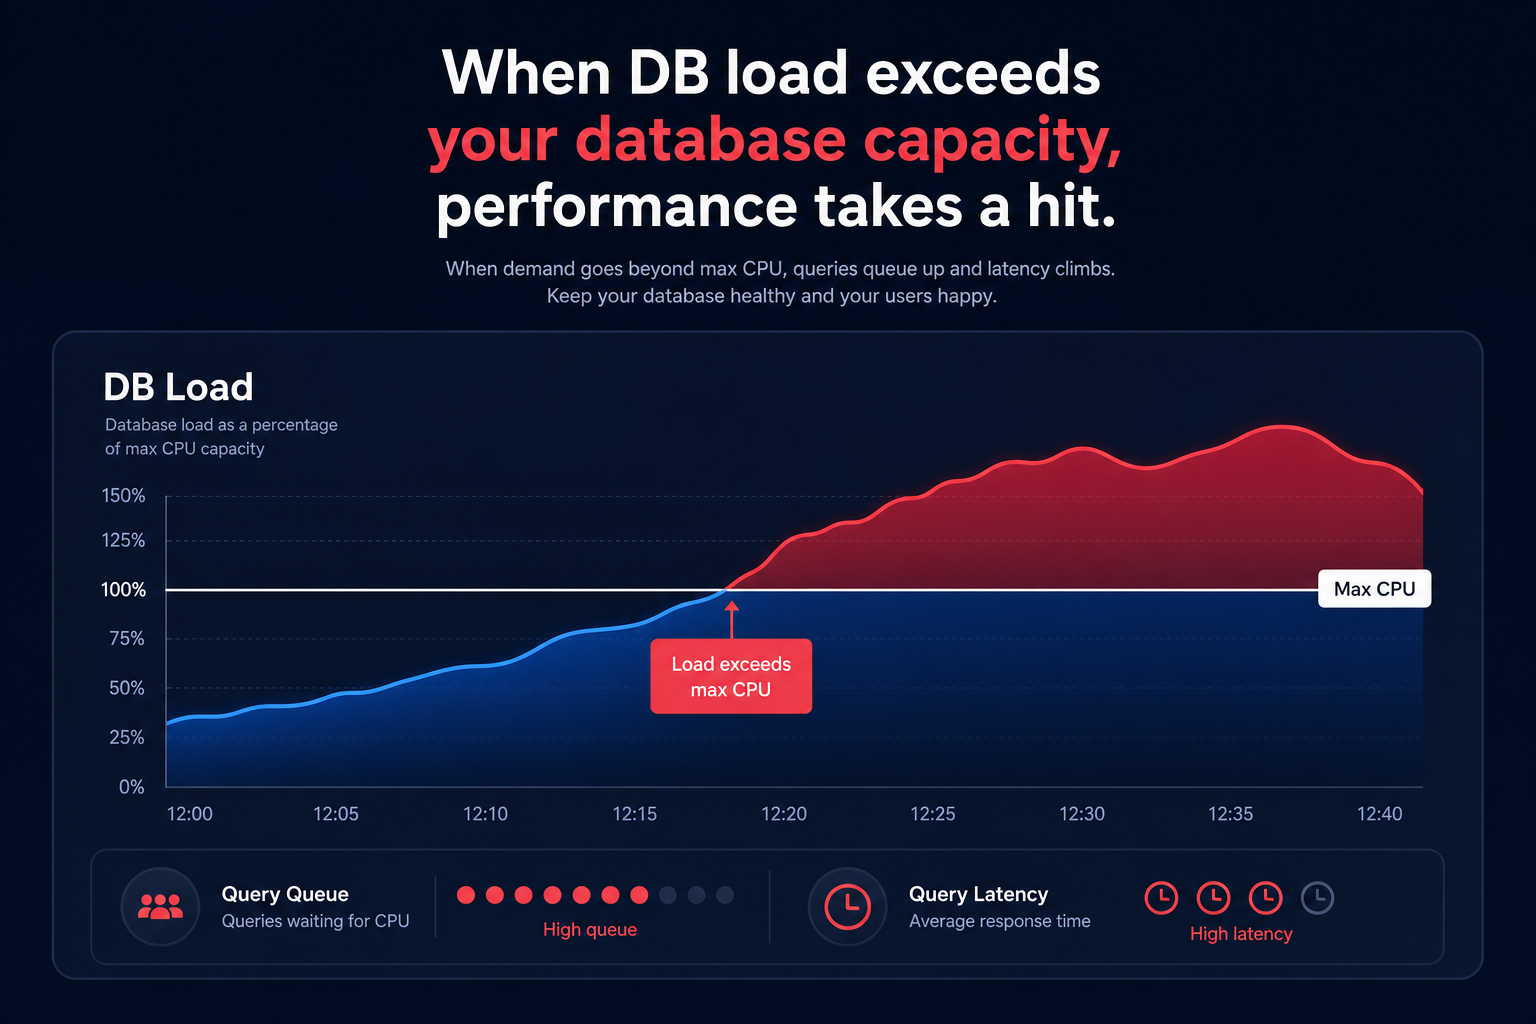
A key advantage for technical managers is the “Max CPU” line. By comparing DB Load against the number of virtual CPUs (vCPUs) available to the instance, you can instantly see if your database is CPU-bound or if a bottleneck exists elsewhere in the stack. If the DB load exceeds the Max CPU line, your application is likely experiencing queuing and latency.
Performance Insights is available for nearly all supported database engines, including MySQL, PostgreSQL, MariaDB, Oracle, and SQL Server. If you are already looking for ways to improve throughput, migrating to Graviton-based instances can provide up to a 40% gain in performance while significantly reducing hourly costs.
Setting up and enabling monitoring
The greatest operational benefit of Performance Insights is that it can be enabled or disabled without causing downtime, reboots, or failovers. You can activate this visibility during the creation of a new instance or by modifying an existing one through the AWS Management Console.
- Select your target DB instance in the Amazon RDS console.
- Choose the Modify option.
- Navigate to the Performance Insights section and select Enable Performance Insights.
- Select your desired retention period, keeping in mind that seven days is the default free tier.
For automated environments, you can use the AWS CLI to modify an existing instance without manually clicking through the console. Running `aws rds modify-db-instance –db-instance-identifier my-db-instance –enable-performance-insights` allows you to integrate monitoring into your infrastructure-as-code workflows. Once enabled, the dashboard provides a top-down view of the SQL statements contributing most to the load, allowing you to pinpoint the exact queries that require RDS MySQL performance tuning or specific index optimization.
Analyzing key CloudWatch metrics
Performance Insights automatically publishes several critical metrics to Amazon CloudWatch. These allow you to set proactive alarms before performance degradation becomes a full-blown outage.
- DBLoad: The total average active sessions reflecting overall database pressure.
- DBLoadCPU: Active sessions specifically waiting for or using CPU cycles, indicating processing saturation.
- DBLoadNonCPU: Active sessions waiting on anything other than CPU, such as disk I/O, memory constraints, or row locks.
- DBLoadRelativeToNumVCPUs: The ratio of DB load to the total number of vCPUs, which acts as a primary indicator of whether your instance is properly sized or needs a read replica to offload traffic.
By integrating these metrics into your broader CloudWatch application monitoring strategy, you can correlate database spikes with application-level traces or log errors to find the root cause of latency.
The transition to CloudWatch Database Insights
AWS has announced a significant shift in how database performance data is consumed. Starting June 30, 2026, the standalone Amazon RDS Performance Insights console experience and flexible retention period pricing will be retired. AWS recommends that organizations transition to Amazon CloudWatch Database Insights, which offers a more unified monitoring experience across your entire fleet.
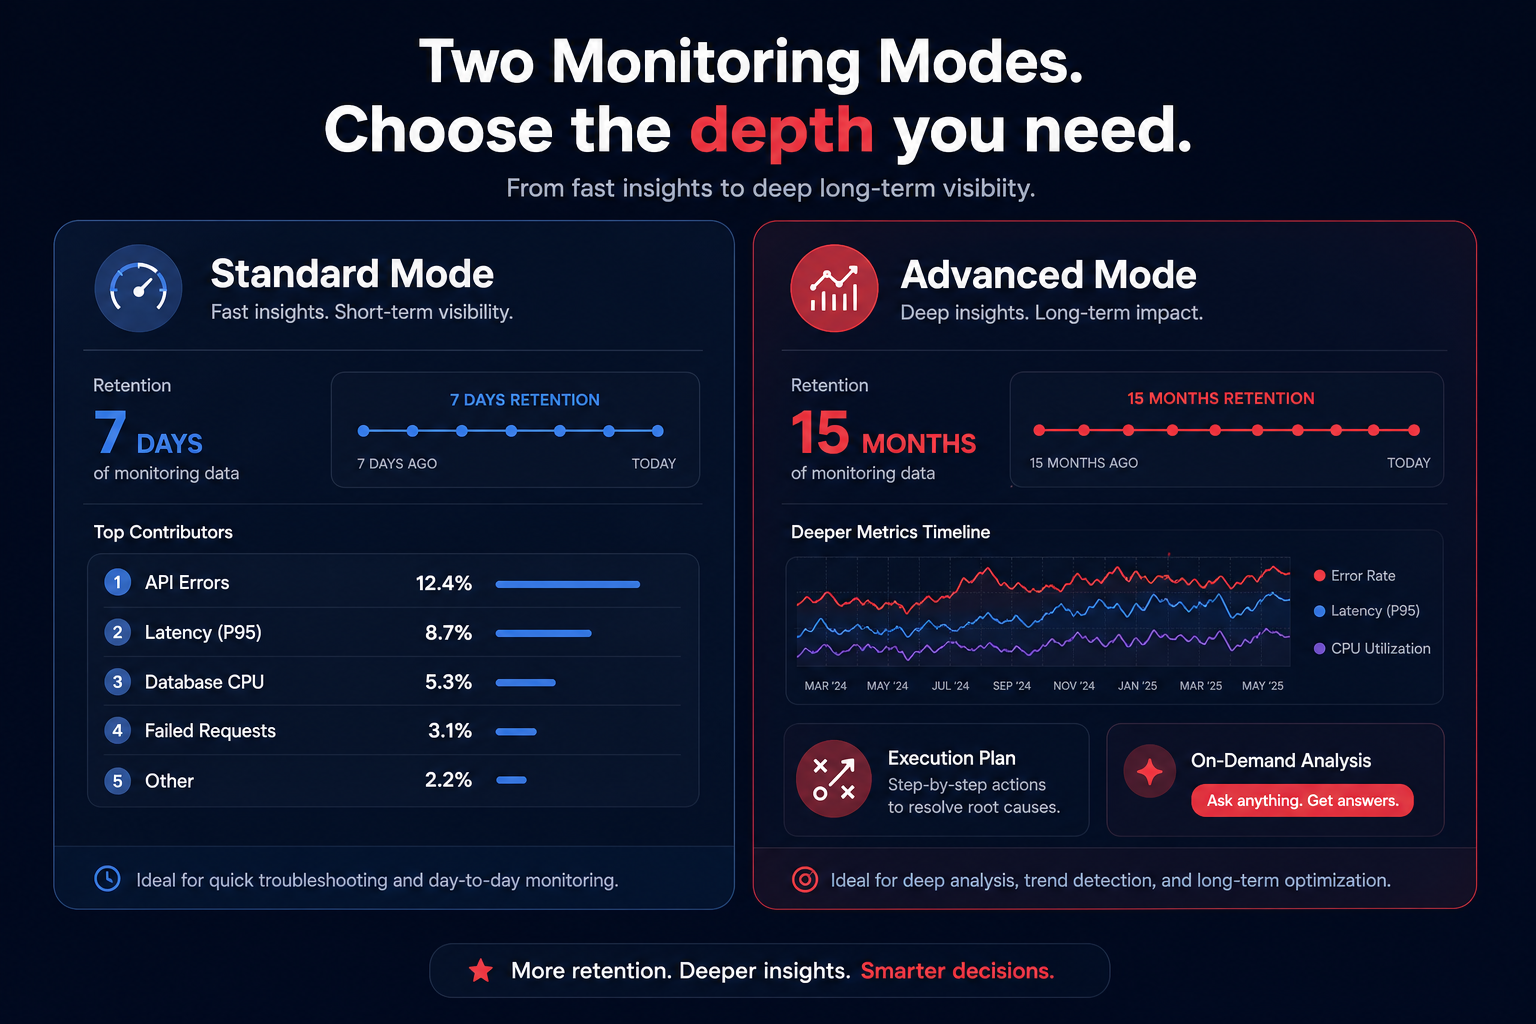
This transition introduces two distinct modes for monitoring. Standard Mode is enabled by default and provides top contributor analysis with seven days of data retention. For deeper historical analysis, Advanced Mode retains 15 months of all metrics and supports advanced features like execution plans and on-demand analysis.
If you currently use the paid tier of Performance Insights for extended retention, you should upgrade your instances to the Advanced mode of Database Insights before the 2026 deadline. This transition is essential for maintaining historical performance data and ensuring your team has the tools for deep-dive lock analysis. However, remember that increased retention and advanced metrics can lead to higher monthly expenses; it is vital to reduce your CloudWatch costs by auditing your retention policies and cardinality regularly.
Turning observability into cost efficiency with Hykell
Monitoring is only half the battle. While tools like Performance Insights tell you why your database is slow, the real challenge for technical decision-makers is balancing that performance with a sustainable cloud budget. High-performance databases often lead to over-provisioned instances and complex CloudWatch logs pricing structures that drain resources.
Hykell provides true cloud-native observability by treating performance and cost as two sides of the same coin. Our platform integrates with your AWS environment to identify underutilized RDS instances and apply AWS rate optimization strategies that can reduce your bill by up to 40% – automatically and without any engineering lift.
We operate on a performance-based model: we only take a slice of what you save, so if you don’t save, you don’t pay. If you are looking to maximize your database throughput while eliminating waste, book a free cost audit or use our cost savings calculator to see exactly how much your organization could be saving.