Are your cross-region latency spikes application bugs or is the AWS backbone hitting a snag? For engineering leaders, distinguishing between the two is the difference between a five-minute fix and a weekend of wasted engineering effort.
As architectures scale across multiple VPCs and regions, the complexity of measuring packet loss and throughput increases exponentially. Network performance is not just a technical metric – it is a direct driver of customer satisfaction and cloud spend. To maintain a high-performing environment, you need a strategy that leverages AWS-native tools without letting observability costs spiral out of control.
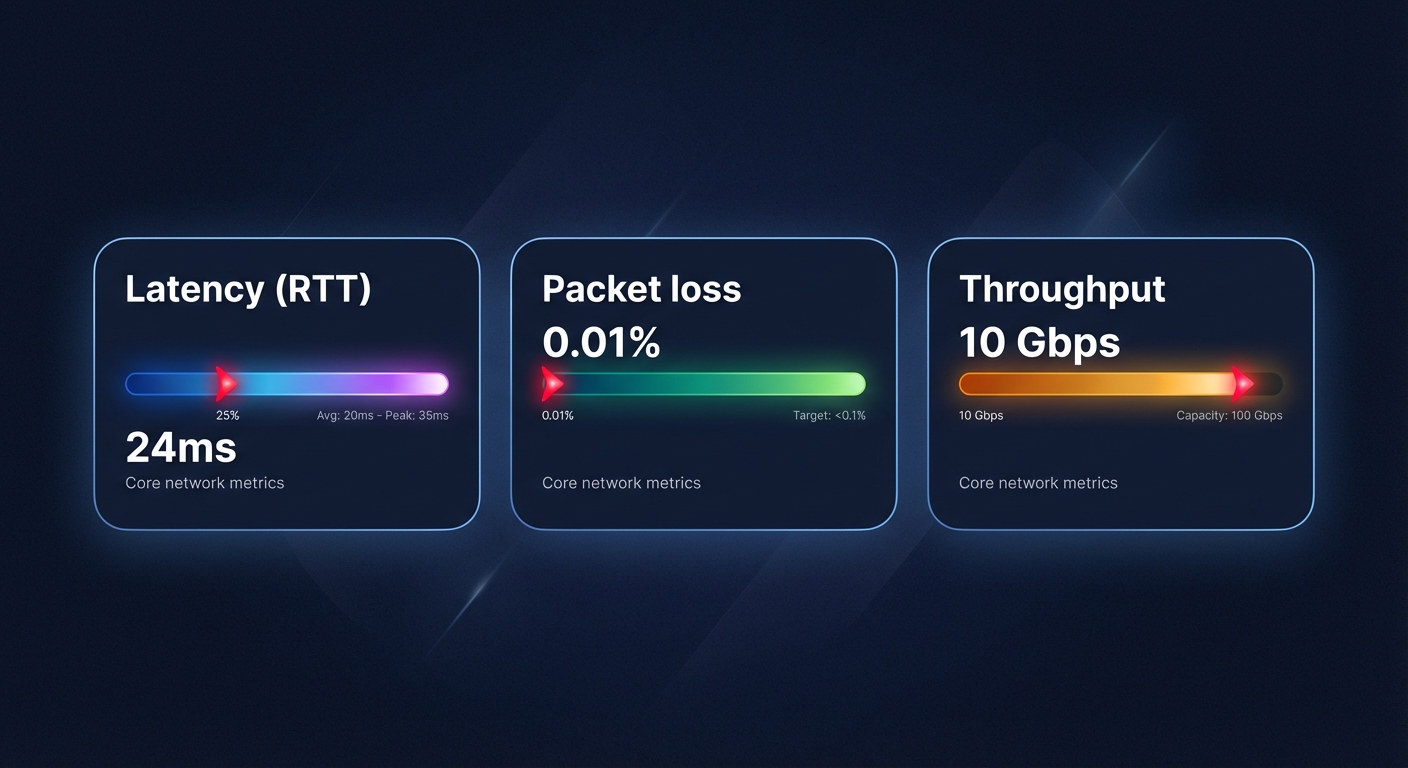
The core metrics of AWS network health
To build a robust AWS network performance monitoring strategy, you must focus on the “Three Pillars” of connectivity:
- Latency (RTT): This is the time it takes for a packet to travel from source to destination and back. In AWS, this varies significantly between intra-AZ, cross-AZ, and inter-region traffic.
- Packet loss: This represents the percentage of packets that fail to reach their destination. Even 1% packet loss can cause TCP throughput to collapse due to retransmission delays.
- Throughput: This is the actual volume of data moving across the wire. This is often limited by EC2 instance sizes or NAT Gateway bandwidth limits.
Monitoring these metrics allows you to establish performance baselines and identify anomalies before they impact your users.
Leveraging AWS CloudWatch Network Monitor
AWS provides managed, agentless visibility into your network health through CloudWatch Network Monitor. This service is essential for teams that want to move away from manual connectivity tests or expensive third-party agents that add overhead to your instances.
Network Flow Monitor
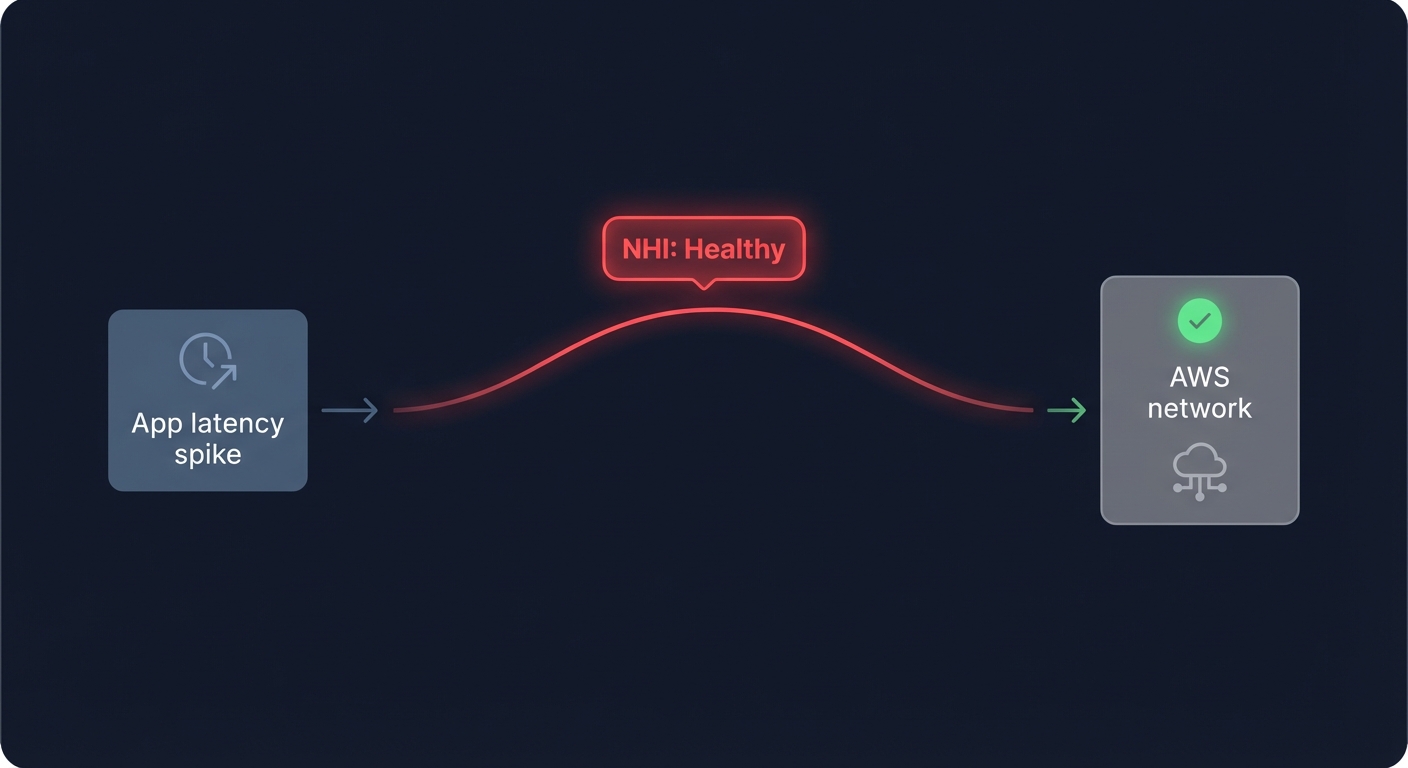
This feature provides near real-time visibility into your VPC-based workloads, including EC2 instances, EKS clusters, and S3 buckets. It tracks TCP-based traffic and generates metrics for packet loss and round-trip time. One of its most valuable features is the Network Health Indicator (NHI). The NHI provides a status of the AWS network itself; if your application latency spikes but the NHI remains healthy, you know the bottleneck lies in your application code or resource configuration, not the underlying AWS infrastructure.
Network Synthetic Monitor
For hybrid environments or critical inter-region links, the Synthetic Monitor acts as a continuous probe of your network health. It uses AWS PrivateLink to securely probe your network paths, providing 24/7 visibility into packet loss and latency without requiring any changes to your application code. This is particularly useful for teams managing AWS Direct Connect or transit gateways. For instance, a financial services company using this tool reduced hybrid network troubleshooting time by 60% by quickly identifying whether latency issues originated within AWS or at their ISP.
Troubleshooting workflows for inter-region latency
When a performance alarm triggers, your team should follow a structured troubleshooting guide to minimize Mean Time to Resolution (MTTR). You can begin by segmenting the path to determine if the issue is confined to a single VPC, an Availability Zone, or a specific Inter-Region Peering connection.
- Consult the NHI: Check the CloudWatch Network Health Indicator. If AWS reports infrastructure issues, you may need to reroute traffic via Global Accelerator.
- Analyze Flow Logs: Use VPC Flow Logs and CloudWatch Logs Insights to look for rejected traffic. A sudden spike in `REJECT` actions often indicates a misconfigured Security Group or Network ACL rather than a physical network failure.
- Correlate with compute: Often, network issues are actually EC2 performance bottlenecks. If an instance hits its network allowance, it will start dropping packets at the NIC level.
Balancing performance with network costs
Network monitoring often reveals that the most performant architectures can also be the most expensive. AWS egress costs for inter-region traffic can become a massive line item if not monitored. Similarly, NAT Gateways charge data processing fees that can easily exceed the cost of the compute resources themselves.
To optimize these costs without degrading performance, you can implement several architectural shifts:
- VPC Endpoints: Route traffic to S3 or DynamoDB through Gateway Endpoints to eliminate NAT Gateway processing fees.
- AZ Alignment: Ensure your application components communicate within the same Availability Zone whenever possible to avoid cross-AZ transfer fees, which typically cost $0.01/GB in each direction.
- Aggressive Log Retention: CloudWatch Logs pricing can spiral if you store verbose network logs indefinitely. Set retention policies to 7 or 14 days for production traffic logs to prevent “zombie” costs from accumulating.
Performance-first cost optimization with Hykell
Most engineering leaders hesitate to implement cost-cutting measures because they fear “breaking” the network or introducing latency. Hykell changes this equation by providing automated AWS cost optimization that operates entirely on the billing and rate layer.
Unlike traditional tools that might suggest aggressive right-sizing which risks CPU starvation, Hykell focuses on rate optimization. We use AI-driven commitment planning to maximize your Savings Plans and Reserved Instance coverage. This reduces your compute and data transfer costs by up to 40% without ever touching your production infrastructure or affecting packet delivery.
By offloading the financial heavy lifting to Hykell, your engineering team can focus on building high-throughput, low-latency architectures. Our observability platform gives you a unified view of your AWS KPIs, correlating your performance gains with real-world savings. Ready to see how much you could save without sacrificing a single millisecond of performance? Calculate your potential savings or book a deep-dive cost audit with the Hykell team today.