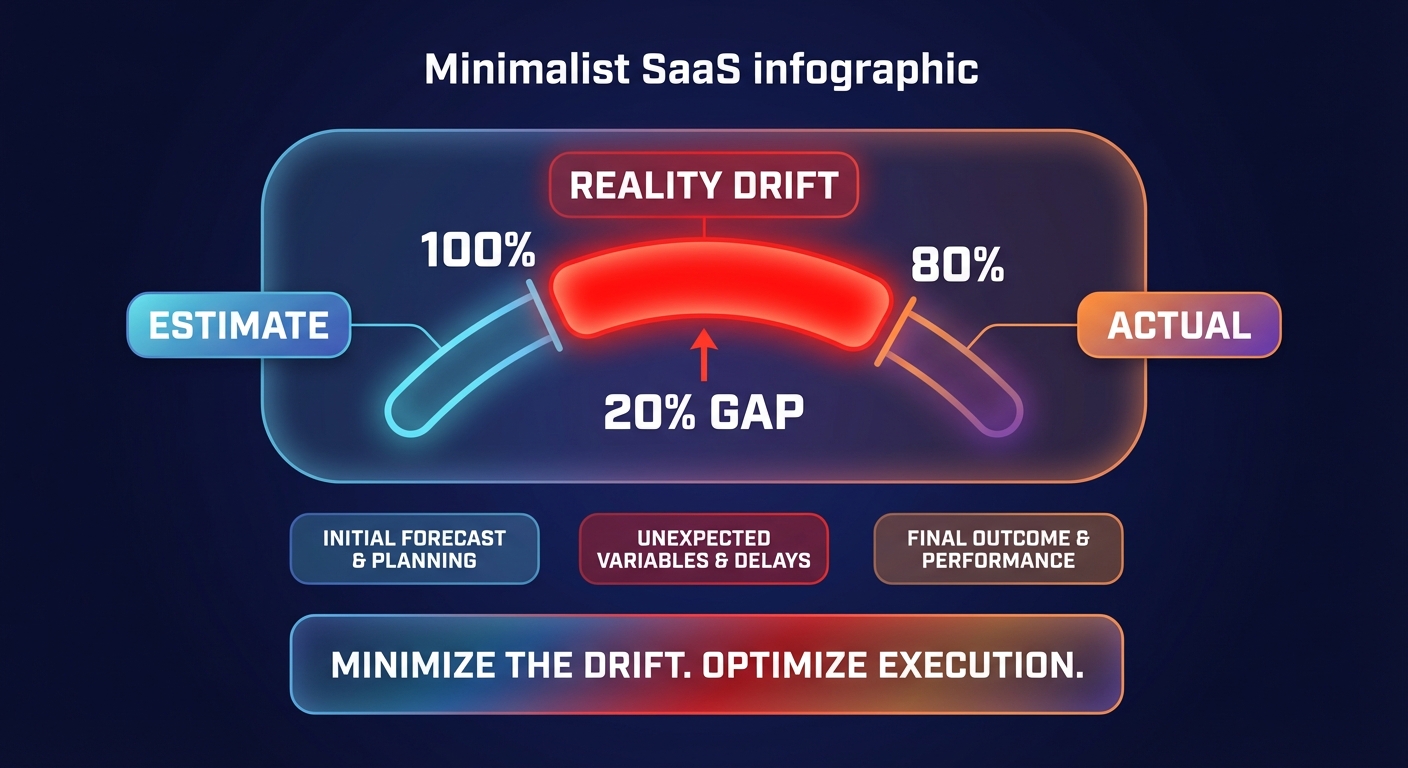
Could your last AWS estimate be off by 20%? Many leaders treat the Pricing Calculator as a definitive predictor, only to face “reality drift” on their invoice. Here is how to master these tools and automate your path to 40% savings.
The AWS Pricing Calculator is a powerful, forward-looking tool that allows you to model “what-if” scenarios for over 200 services without needing an active AWS account. It serves as your primary instrument for architectural planning, helping you understand how specific configuration choices – such as choosing between EBS gp2 and gp3 volumes – will impact your monthly spend. However, for existing workloads, manual estimates often fall short of production complexity. To achieve true accuracy, you must reconcile these projections with the historical data found in AWS Cloud Cost Explorer.
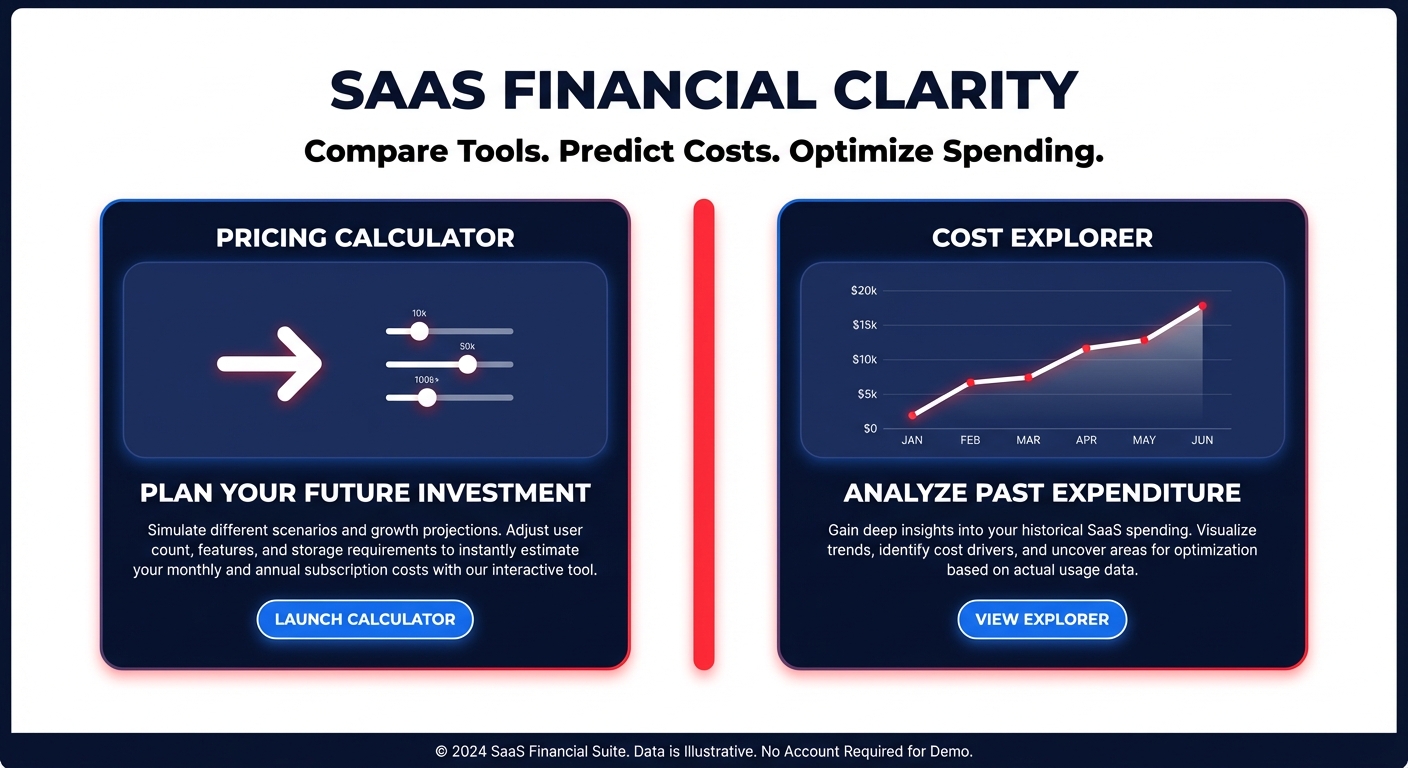
The core difference: Pricing calculator vs. Cost explorer
Understanding when to use each tool is critical for achieving FinOps maturity. The Pricing Calculator is input-driven, relying entirely on your assumptions about vCPU needs, memory requirements, and traffic patterns. While it provides immediate feedback on architectural theories, it cannot predict the costs of unprovisioned microservices or account for your current Free Tier eligibility. For more detailed guidance on these nuances, you can consult our AWS Pricing Calculator guide.
In contrast, AWS Cloud Cost Explorer is backward-looking. It analyzes your historical billing data to provide 12-month forecasts based on actual usage patterns. While the calculator helps you plan a migration, Cost Explorer identifies where your current spend deviates from those plans. The most effective strategies use both tools in tandem to bridge the gap between architectural theory and billing reality.
Navigating the pitfalls of manual cost estimation
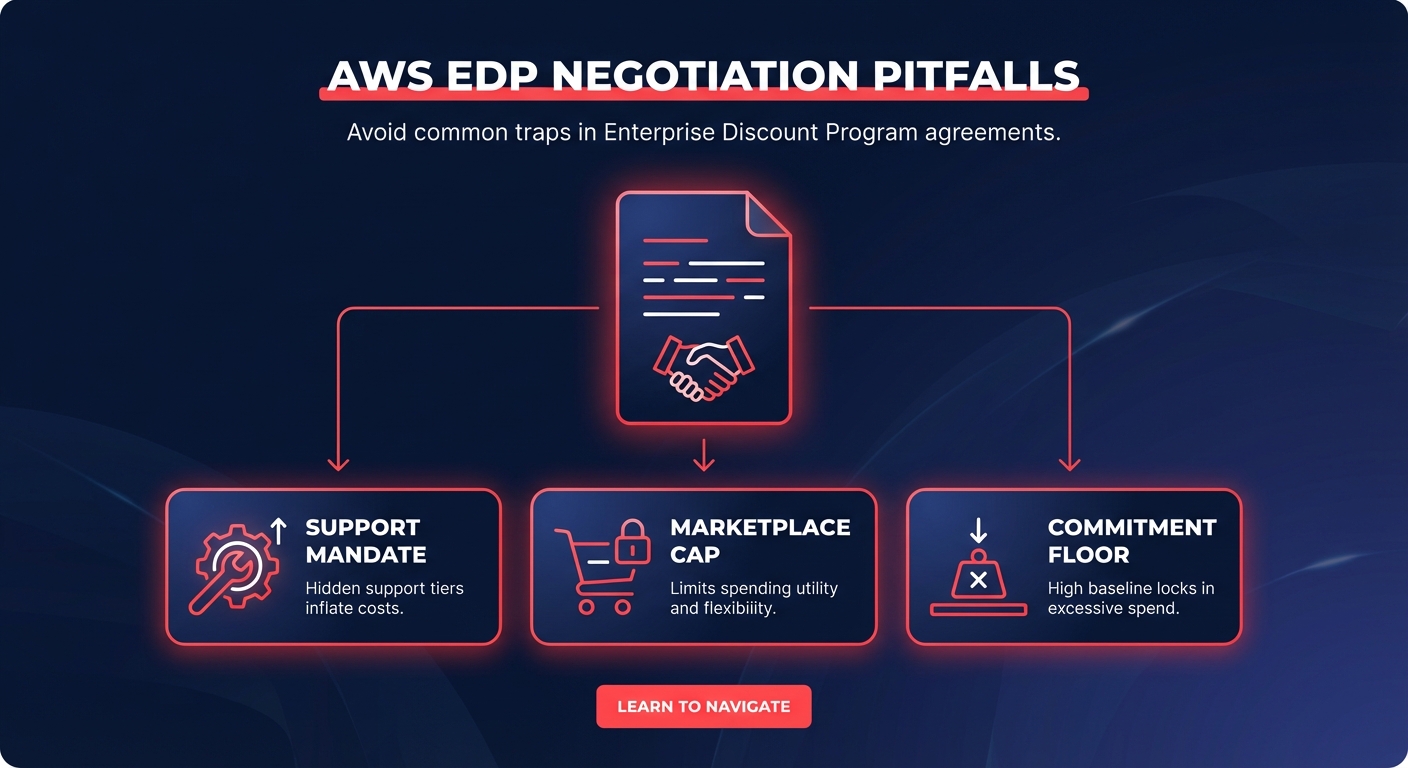
While the Pricing Calculator is an essential starting point, it has several built-in assumptions that can lead to significant budget overruns. For instance, the tool typically uses a fixed 730-hour month for compute pricing, which rarely aligns with the per-second billing you experience in a dynamic production environment. Furthermore, manual estimates usually exclude taxes and support plan fees, which can easily add a hidden 10% to your total bill.
One of the most common oversights in manual modeling involves data transfer costs. Cross-AZ data transfers typically cost $0.01/GB in each direction. In high-availability architectures where replication is frequent, these “invisible” fees can represent 25–35% of your total spend. If you are not explicitly modeling these transfers, your estimate is incomplete. Additionally, manual tools cannot ensure you are utilizing the most cost-effective EC2 instance type selection guide, often leaving you on older, more expensive hardware generations.
Bridging the visibility gap with automated optimization
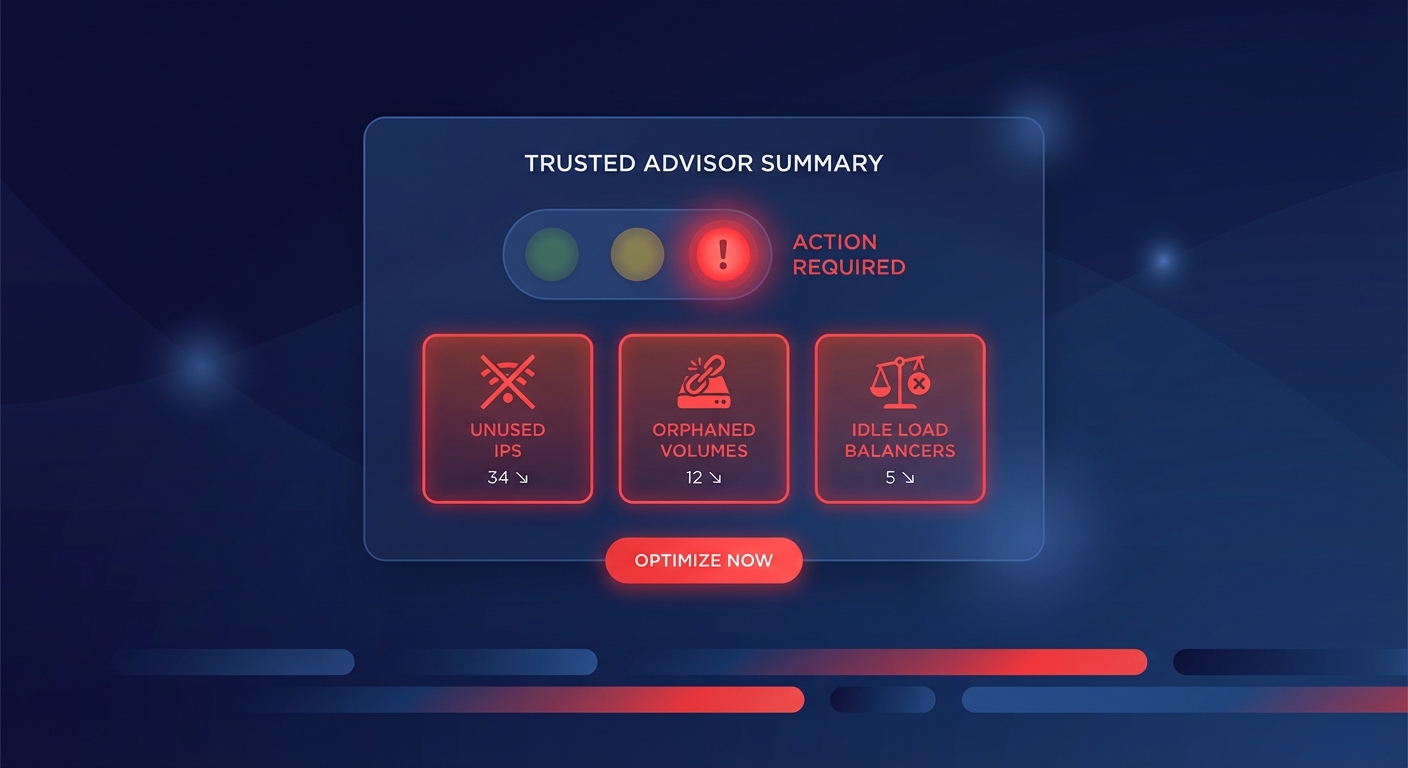
Even the most meticulous estimates eventually encounter “reality drift.” Recent research indicates that reconciliation against 90 days of historical data often reveals actual spend deviates from estimates by more than 20%. This discrepancy usually points to over-provisioned resources or “shadow” infrastructure that wasn’t included in the initial model. While a calculator shows you what you could spend, it cannot execute the optimizations required to lower that spend once the workload is live.
This is the specific problem Hykell was built to solve. While native AWS tools provide visibility, Hykell delivers automated cloud cost optimization that works on autopilot. Instead of manually re-calculating your AWS Savings Plans vs. Reserved Instances every time your architecture changes, our platform manages your commitment portfolio in real-time to ensure maximum coverage with minimum risk.
Transitioning from static visibility to automated action
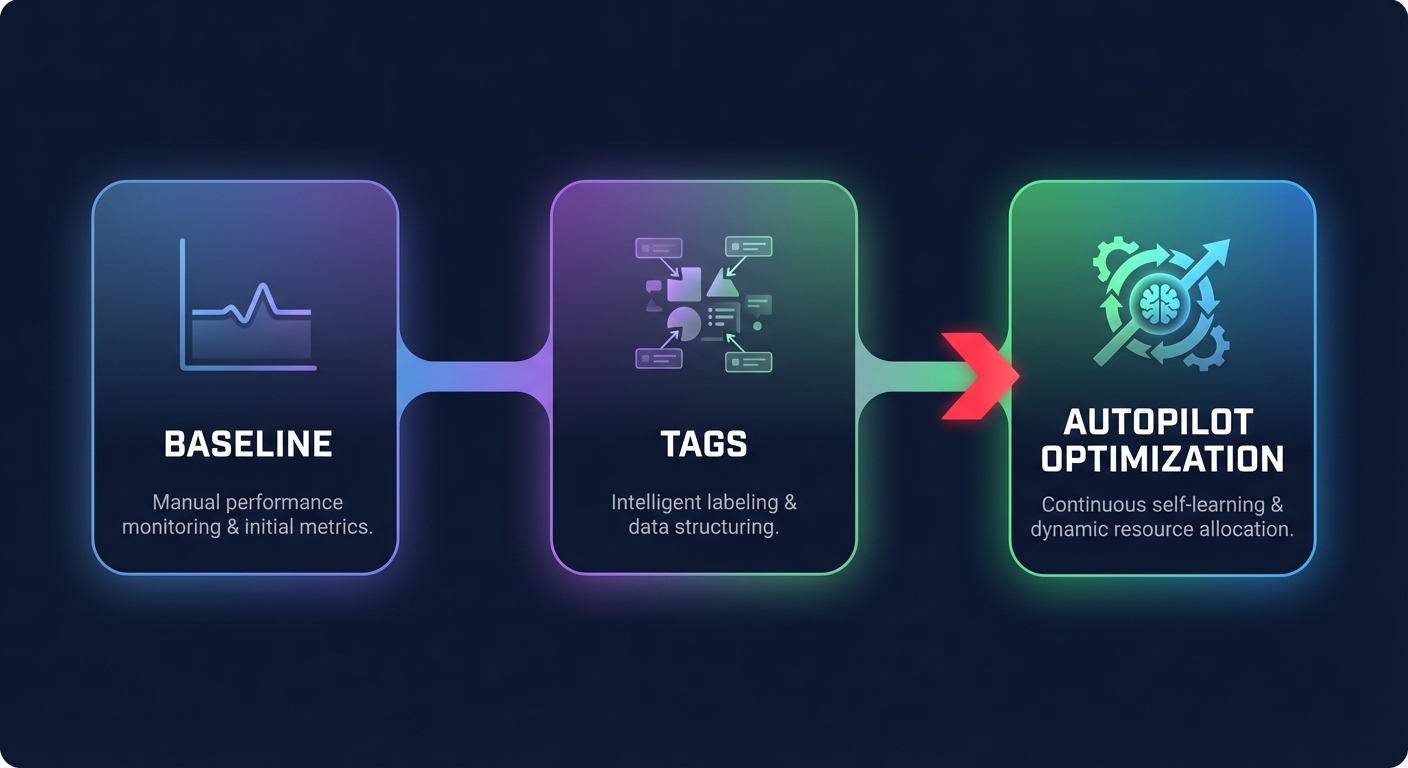
For engineering leaders, the goal is not just to predict costs but to control them. You should start by using an AWS instance cost calculator to set a baseline for new projects. Once those projects go live, you must implement AWS cost allocation tags to ensure every dollar is attributed to the correct team or service.
If your actual spend starts to exceed your initial estimates, you do not need to spend dozens of engineering hours manually rightsizing resources. You can accelerate your Graviton gains and optimize your infrastructure automatically. Real-world savings come from continuous, automated adjustments rather than one-time manual estimates.
Hykell dives deep into your infrastructure to uncover hidden savings, optimizing everything from EBS volumes to Kubernetes clusters. We only take a slice of what you save – if we do not find savings in your environment, you do not pay. Discover how much you could be saving today by scheduling a detailed cost audit.