Is your application’s growth being stifled by “ProvisionedThroughputExceeded” exceptions despite having plenty of idle capacity? When DynamoDB latency spikes, the root cause is rarely the service itself but rather how your data access patterns collide with physical partition limits.
Solving the hot partition bottleneck
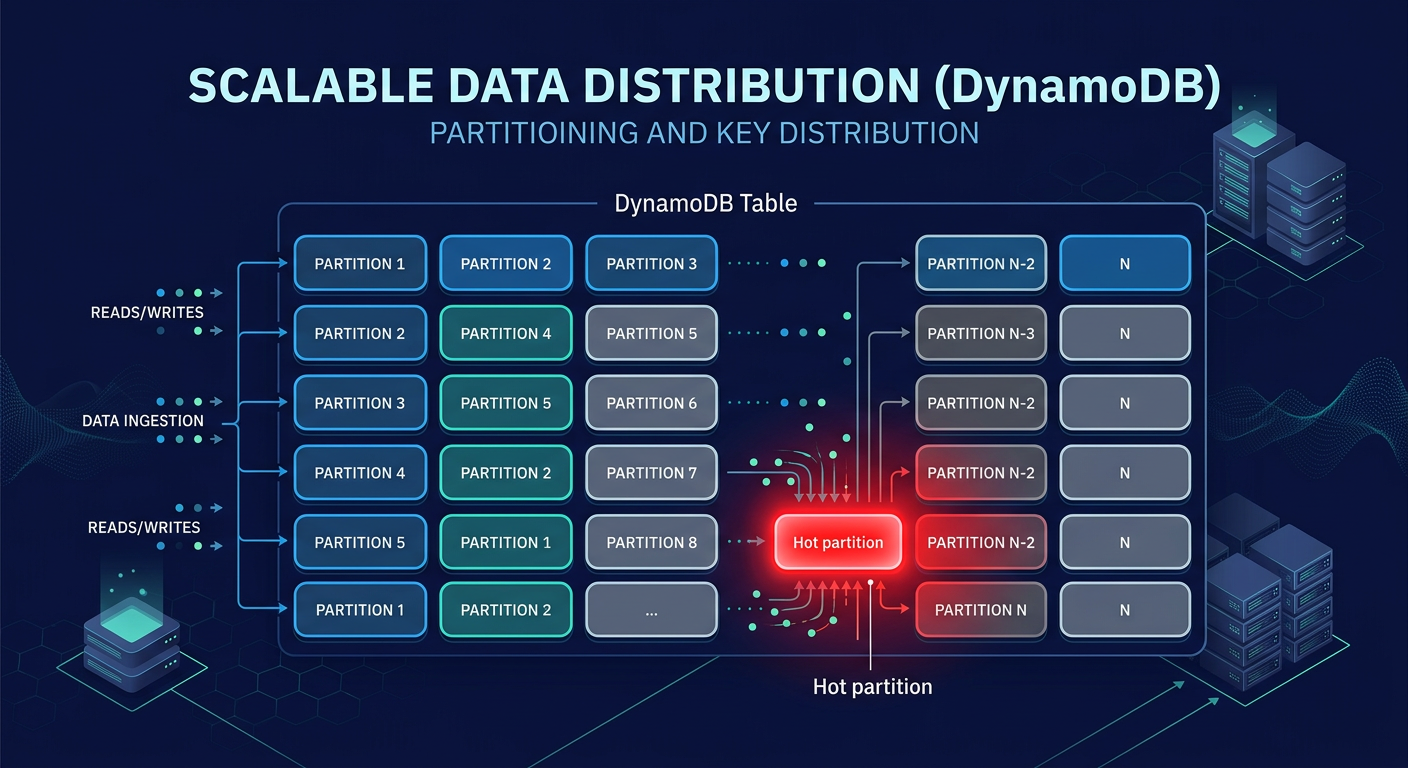
DynamoDB manages data by distributing items across multiple partitions based on your partition key (PK). While a table can scale to virtually infinite throughput, individual partitions are capped at 3,000 Read Capacity Units (RCUs) and 1,000 Write Capacity Units (WCUs). A “hot partition” occurs when a single PK receives disproportionate traffic, exceeding these thresholds even if your total table-level provisioned capacity remains sufficient.
Common culprits include low-cardinality keys, such as using a “status” or “boolean” flag as a partition key. When thousands of users write to the same `status=active` partition, you create a massive bottleneck. You can identify these hotspots using AWS CloudWatch application monitoring, which provides Contributor Insights to identify the top-10 most frequently accessed keys. If your p99 latency jumps from single digits to over 500ms, or if your throttled requests exceed 1%, it is time to re-evaluate your key distribution.
High-cardinality keys and write sharding
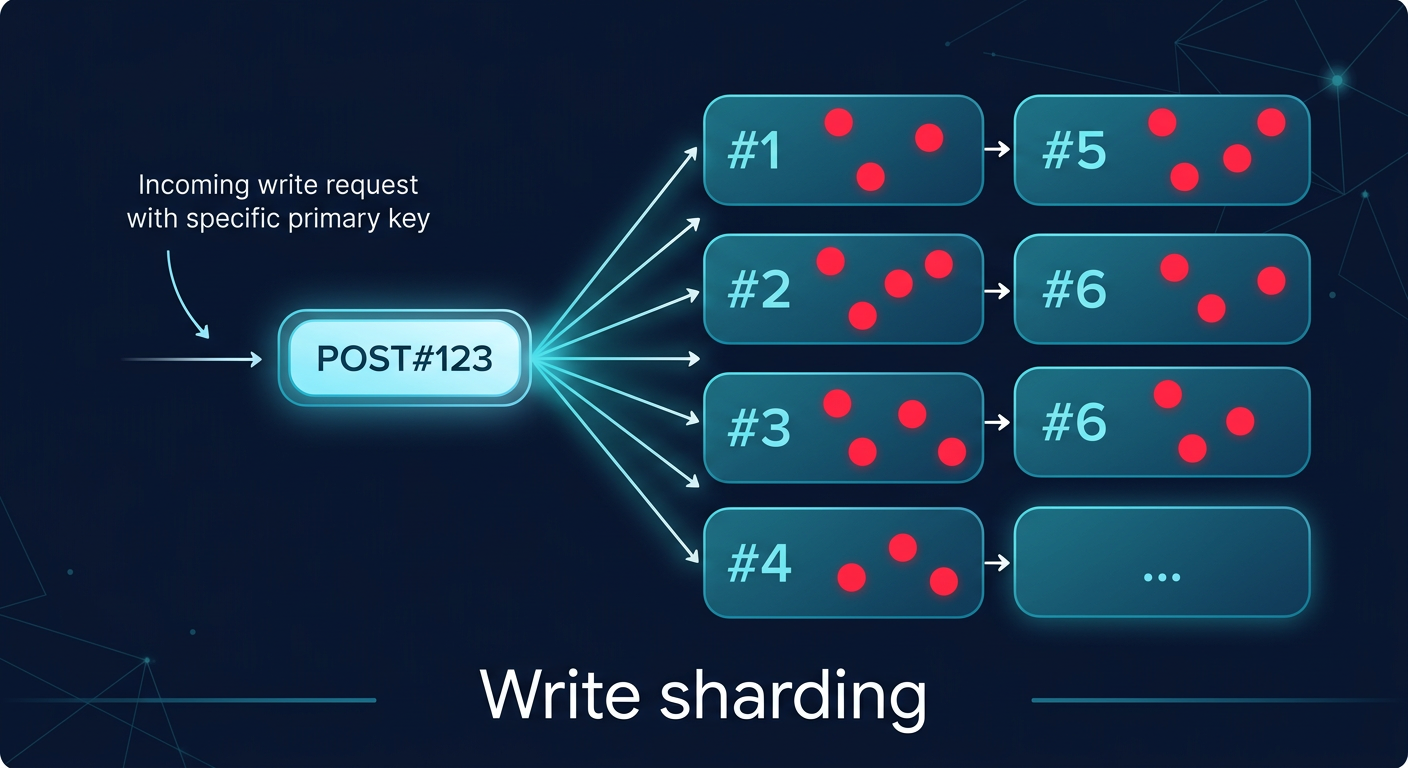
To ensure even distribution, you must select partition keys with high cardinality, such as a `UUID` or `customer_id`. In scenarios where a single entity naturally attracts heavy traffic – like a viral social media post – you should implement write sharding. This technique involves appending a random suffix, such as `POST#123#1` through `POST#123#200`, to the partition key to spread writes across 200 different partitions. Netflix successfully applied sharding to its DynamoDB tables, reducing hot partition throttling by 70% and dropping p99 latency from 500ms to 50ms.
For time-series data, composite keys and time-bucketing prevent “tail-end” hotspots where all new data hits the same physical partition. By combining a date string with a high-cardinality attribute, such as `2024-05-20#sensor_456`, you ensure that today’s data is spread across the entire fleet of partitions. Duolingo utilized time-bucketing to achieve a 5x increase in write throughput. These techniques are essential for maintaining cloud latency reduction techniques as your dataset grows into the terabyte range.
Indexing trade-offs: LSI vs. GSI
Secondary indexes allow you to query data using attributes other than the primary key, but they come with significant performance and cost trade-offs. Local Secondary Indexes (LSIs) share the same partition key as the base table and allow for strong consistency. However, they are limited by a 10GB size cap per partition key, and they contribute to write amplification, effectively doubling your WCU consumption for every item update.
Global Secondary Indexes (GSIs) offer more flexibility, as they can have a completely different partition key and scale their throughput independently. While GSIs are eventually consistent – often with a 100-200ms replication lag – they are the standard for large-scale applications. Beware of over-indexing; adding more than five GSIs per table often causes more than 20% write throttling at scale. To optimize costs, use sparse indexes by only including attributes in the index that are present in the items you actually need to query. This approach mirrors the optimization logic used in AWS Aurora performance tuning, where minimizing unnecessary data structures directly translates to faster I/O.
Capacity management and cost optimization
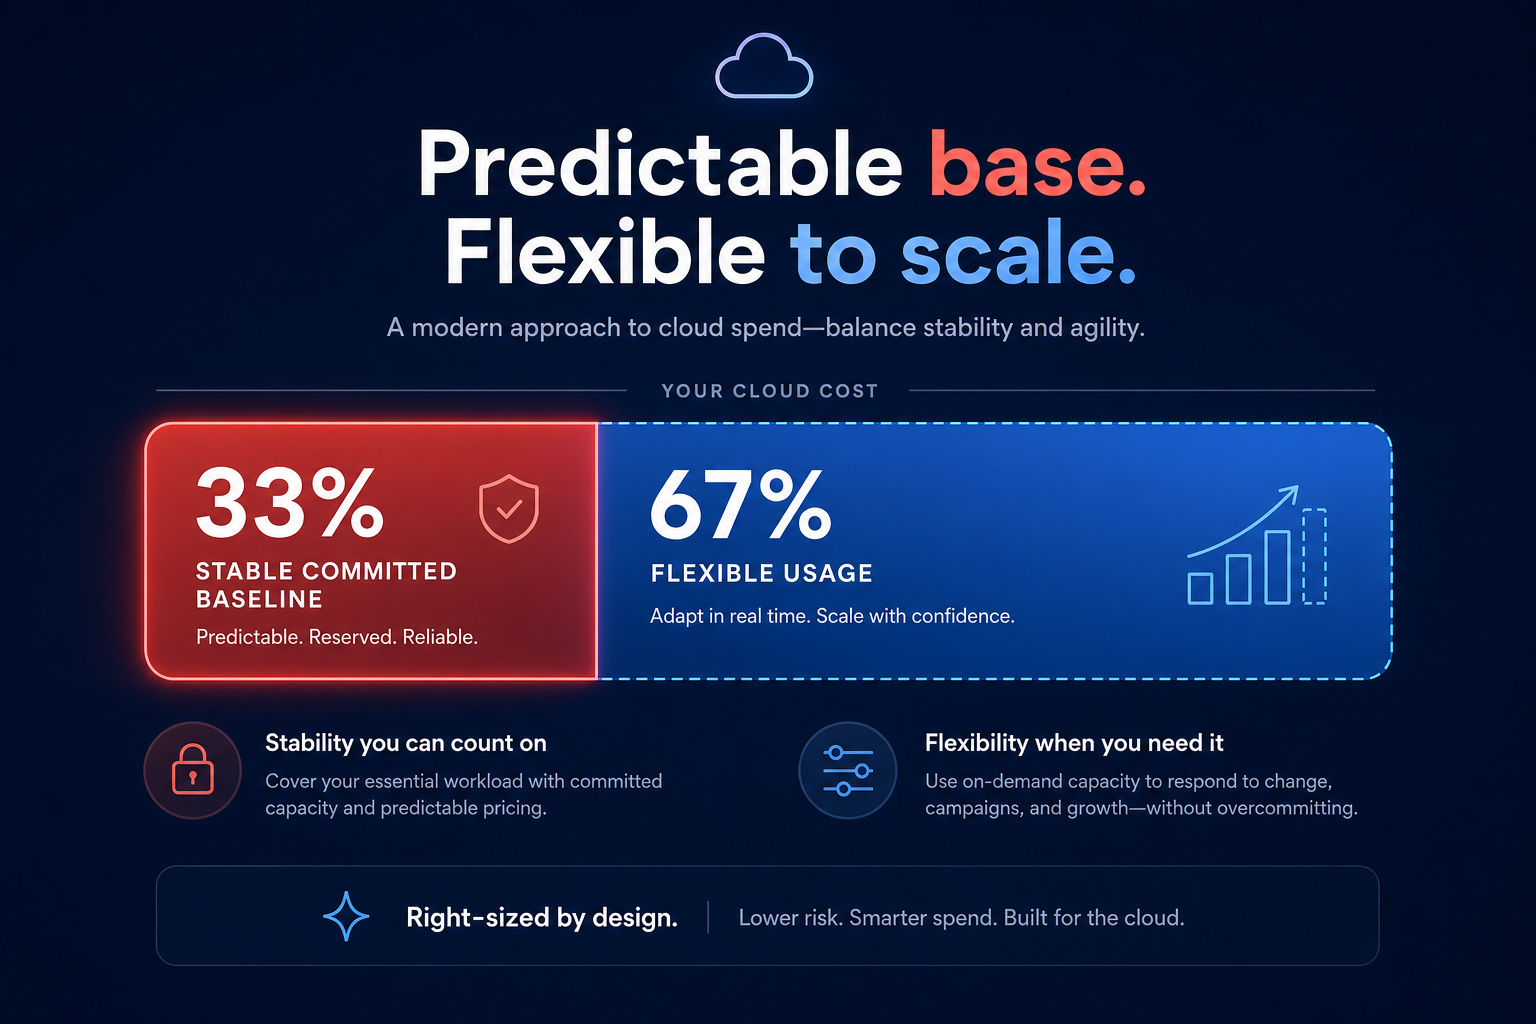
Choosing between Provisioned and On-Demand capacity is a decision that balances predictability against agility. On-Demand mode is ideal for unpredictable bursts but carries a 25% higher price tag per request. For steady-state workloads, Provisioned capacity with auto-scaling is more cost-effective, though it reacts to spikes in 1-5 minutes, which can lead to transient throttling.
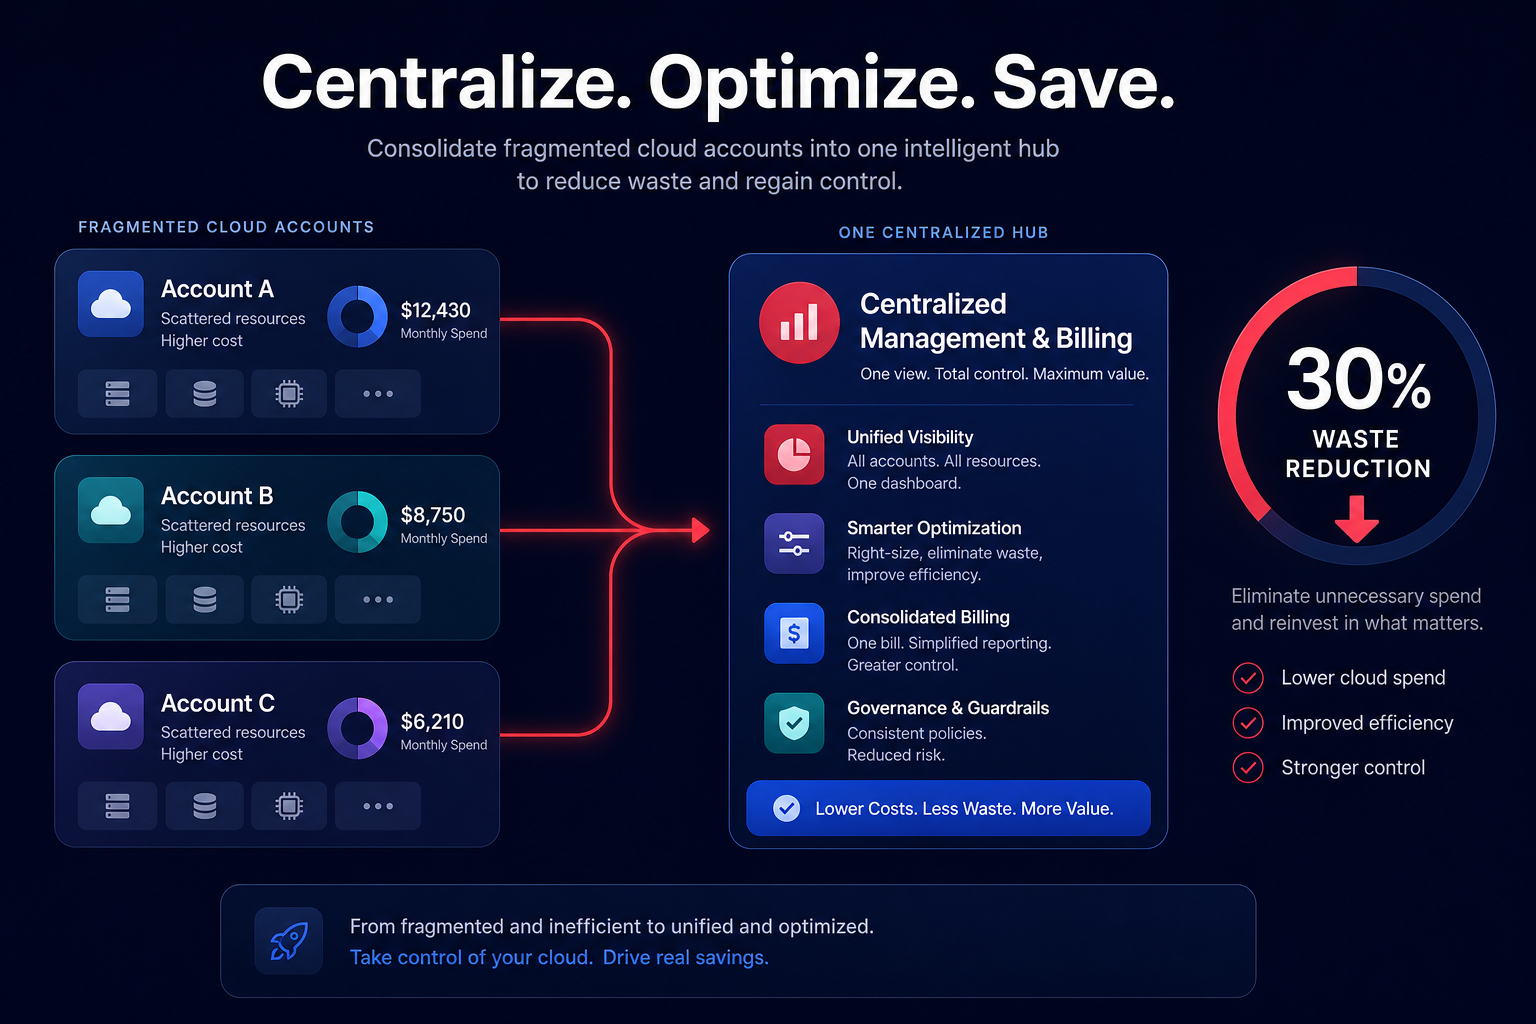
Monitoring your consumption through a cloud performance troubleshooting guide is critical; if consumption consistently exceeds 80% of provisioned limits, you risk performance degradation. Hykell provides automated AWS cost optimization services to monitor these cloud application performance monitoring metrics in real-time, helping you identify underutilized capacity that can be reclaimed. Our automated rate optimization ensures your infrastructure is always right-sized, often reducing total AWS costs by up to 40% without requiring manual engineering intervention.
Building an observability-first architecture
A high-performance DynamoDB implementation is only as good as its monitoring. You need visibility into AWS network performance monitoring and service-level metrics to distinguish between database hotspots and VPC-level latency. Alarms should be set on `ThrottledRequests` and `SuccessfulRequestLatency` to ensure you are meeting your AWS performance SLA requirements.
As you scale, the cost of logging and monitoring can become a significant portion of your budget. Managing CloudWatch logs pricing requires aggressive retention policies and the use of metric filters to avoid ingesting noisy data. The Hykell observability dashboard simplifies this by rolling up data from hundreds of accounts, providing the granular cost and usage breakdowns needed to keep your performance-to-price ratio optimized.
By mastering partition key design and leveraging automated optimization tools, you can ensure your DynamoDB architecture remains both lightning-fast and cost-efficient. To see exactly how much your organization could save on AWS while maintaining peak performance, use the Hykell cost savings calculator or book a free cost audit today.