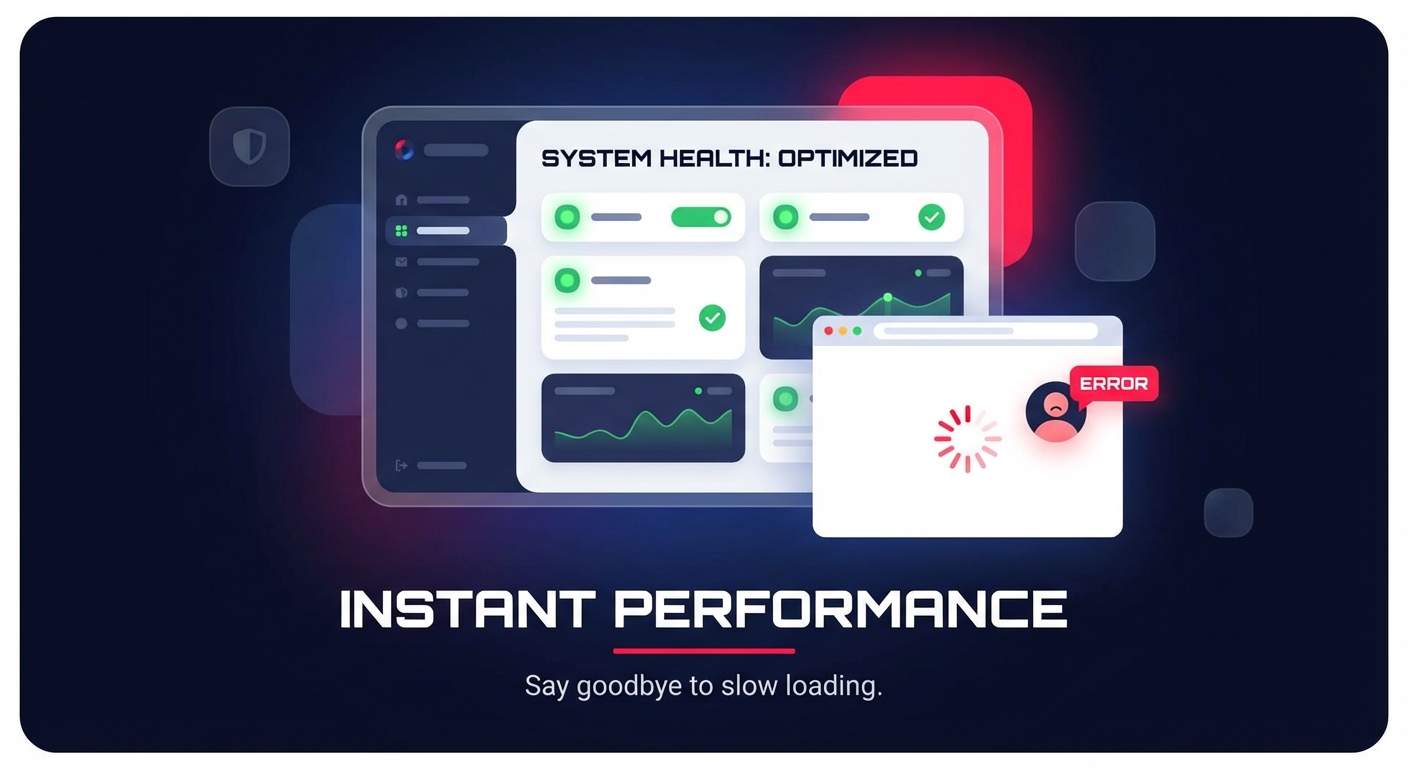
Is your AWS dashboard showing all green while your customers report slow page loads? Traditional infrastructure monitoring often misses the “silent killers” of SaaS performance, like client-side latency. Here is how to move beyond basic uptime to true performance observability.
How SaaS APM differs from traditional monitoring
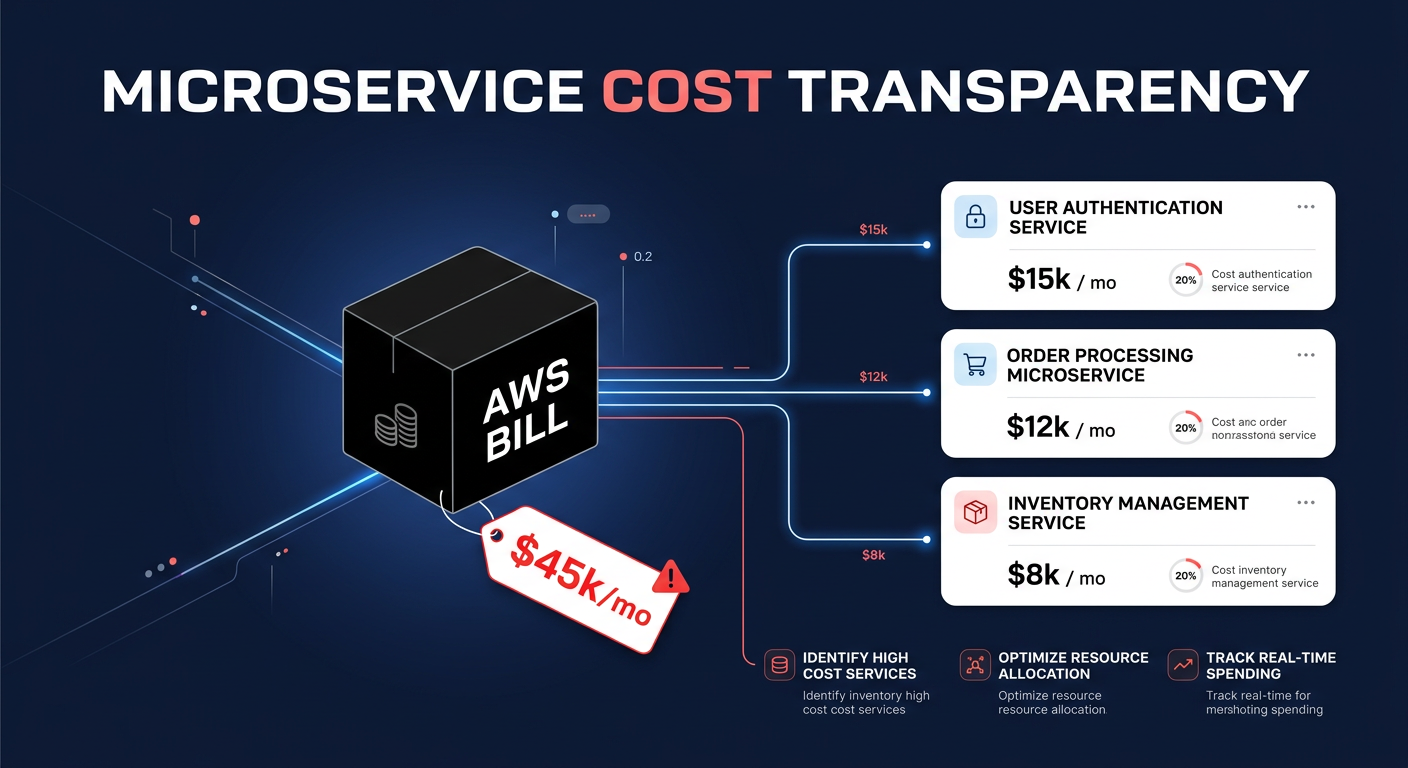
Traditional monitoring tools were built for static, on-premise environments where engineers controlled every layer of the physical stack. In a modern AWS-based SaaS environment, your architecture likely consists of a distributed web of containers, serverless functions, and managed services. Adopting modern SaaS application performance monitoring requires a shift from tracking server health to correlating performance with business outcomes.
While legacy tools might alert you when an EC2 instance hits high CPU usage, SaaS-native monitoring identifies when a specific microservice causes a 500ms delay for your highest-paying customers. This transition is essential because modern cloud architectures include serverless functions and complex database interactions that behave differently than traditional servers.
Unified visibility across these distributed systems is the only way to track the error rates and user experience metrics that actually matter. Crucially, your monitoring strategy must account for the client-side experience. Server-side metrics may appear perfect while users suffer through sluggish interactions caused by network latency or complex client-side rendering. Comprehensive cloud application performance monitoring ensures you have end-to-end visibility from the backend to the browser.
Key metrics and SLOs for AWS-based SaaS
Moving from reactive troubleshooting to proactive management starts with tracking metrics that impact user retention. Instead of relying on averages, you should focus on metrics that reveal the true health of your application.
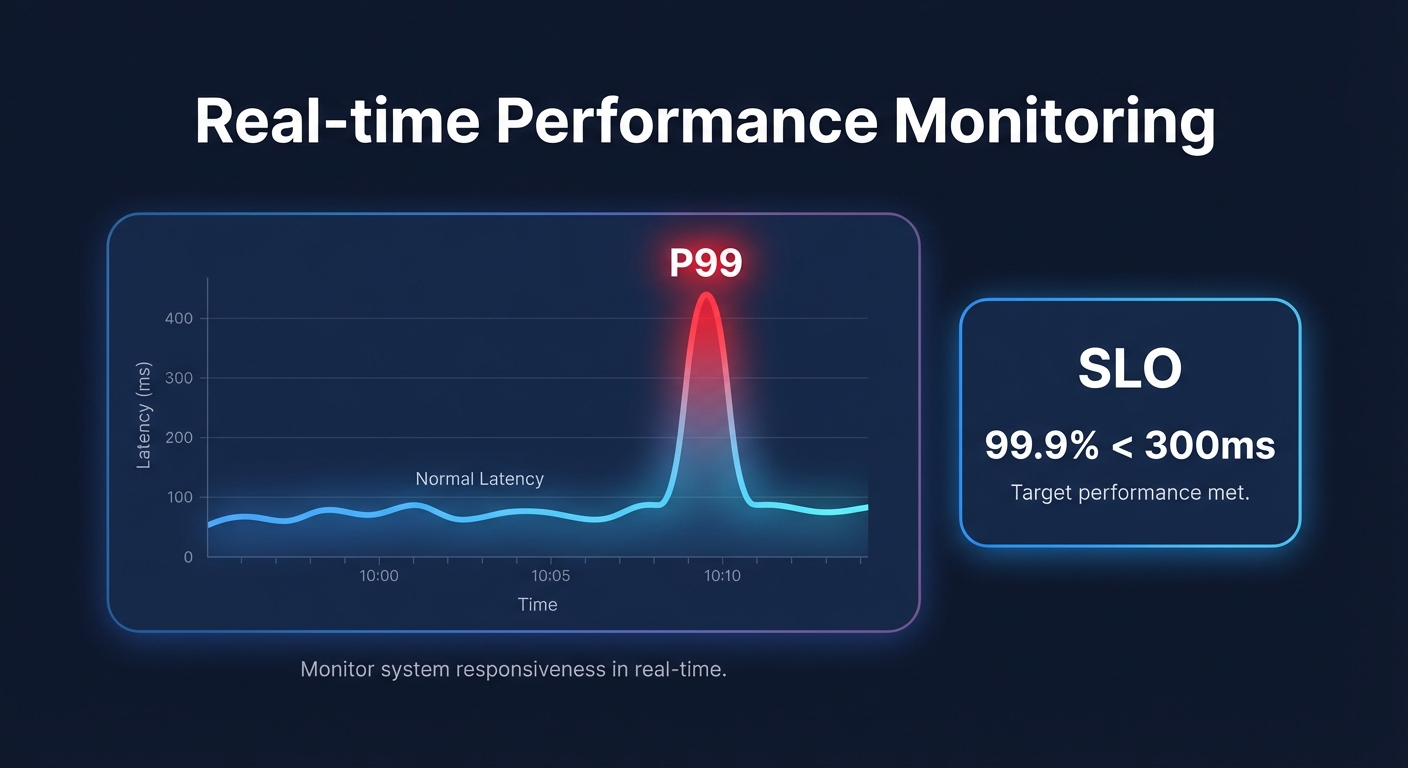
- Tail Latency (P99): Average response times often hide outliers that frustrate a small but vocal percentage of your user base. Tracking high percentiles reveals worst-case delays that usually point to database locks or Amazon EBS latency spikes.
- Transaction-Based SLOs: Move beyond simple uptime percentages. Effective Service Level Objectives (SLOs) should state something like “99.9% of customer checkout transactions will complete in under 300ms.” This ties technical performance directly to user satisfaction.
- Saturation Metrics: You must monitor indicators like `VolumeQueueLength` for EBS volumes. When IOPS saturation occurs, performance degrades rapidly even if your CPU and memory metrics look healthy.
- Cost per Transaction: In a SaaS business model, tracking the cost per unit of work processed is vital. This ensures that your performance gains are not quietly eroding your profit margins.
Monitoring third-party SaaS dependencies
Modern SaaS applications rarely run in isolation. Your product likely depends on a suite of external services for payments, authentication, and communication. When one of these third-party providers slows down, your application appears slow to the end-user, regardless of how well your own code is performing.
To gain visibility into these “black box” dependencies, you should utilize AWS CloudWatch application monitoring to run proactive canaries. These synthetic scripts mimic real user journeys – such as a login flow or a checkout process – to detect API failures or latency before they impact your actual traffic.
By correlating these synthetic results with AWS network performance monitoring, you can quickly determine if a lag is originating from your code, an external service provider, or an ISP routing issue. This visibility allows your team to stop wasting time debugging internal systems when the issue lies with an external partner.
Balancing performance and AWS costs
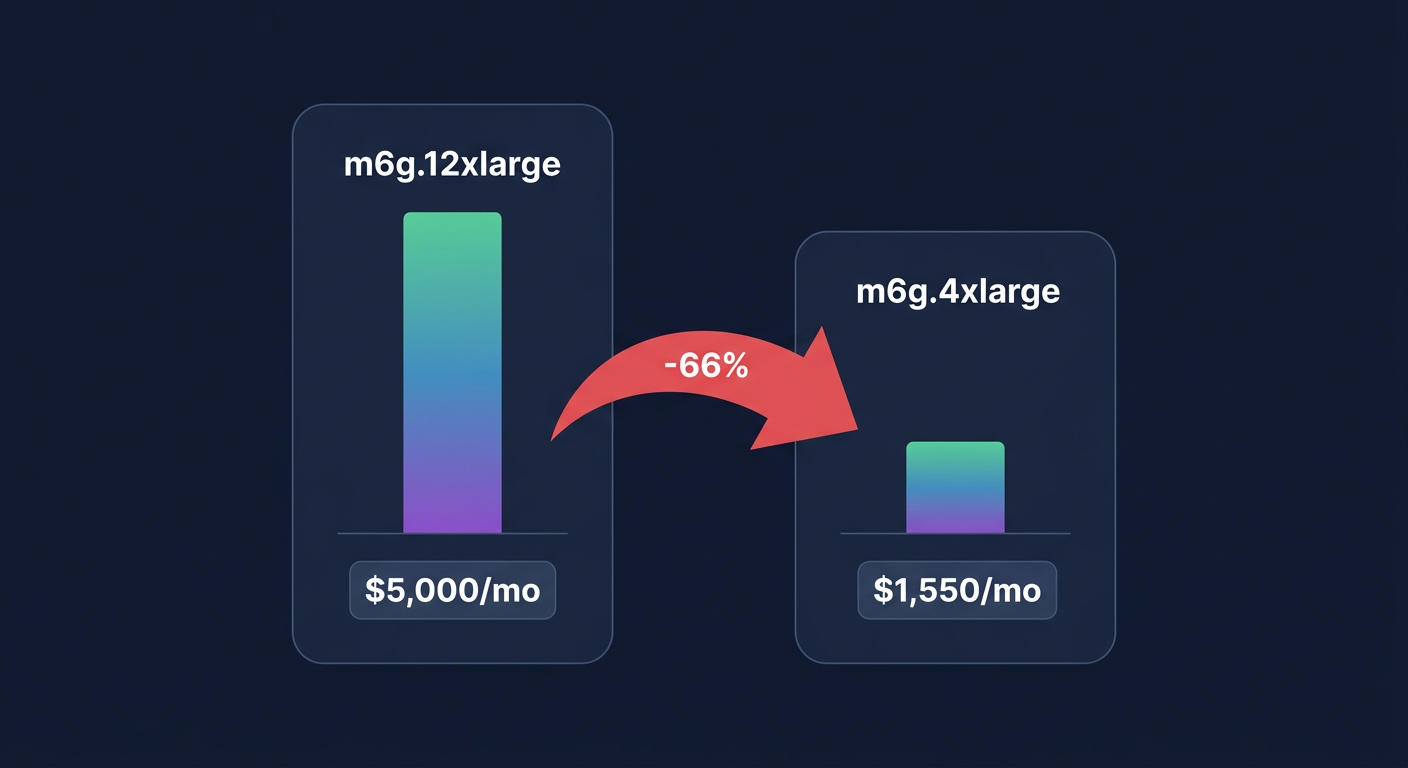
A common trap for growing SaaS companies is overprovisioning resources to ensure high availability. However, ballooning cloud costs can be just as damaging to your business as high latency. You can often achieve better performance at a lower price point by intentionally selecting newer AWS technologies and optimizing your storage tier.
For example, implementing AWS Graviton compatibility allows you to leverage ARM-based instances that typically offer 20% lower pricing than x86 equivalents while delivering superior performance for many workloads. Similarly, moving from EBS gp2 to gp3 volumes allows you to decouple IOPS from capacity, which can reduce storage costs by 20% while maintaining consistent, single-digit millisecond latency.
The key is to use cloud observability tools to find the “price-performance tightrope.” By identifying underutilized services that are over-provisioned, you can consolidate resources and reinvest those savings into high-priority performance areas, like transactional databases that require io2 volumes for guaranteed throughput.
Optimizing your SaaS stack with Hykell
Maintaining the perfect balance between peak application performance and lean cloud spending usually requires hundreds of manual engineering hours every year. Hykell eliminates this burden by providing automated AWS rate optimization and infrastructure rightsizing that runs on autopilot.
Hykell works silently in the background, analyzing your CloudWatch metrics and usage patterns to apply optimizations that reduce your total AWS spend by up to 40%. Because the platform integrates directly with your existing environment, there is zero engineering lift and no code changes required. This allows your DevOps team to focus on building new features rather than manually tweaking instance sizes or managing reserved instances.
We operate on a performance-based model, meaning we only take a percentage of the actual savings we generate for your business. If you don’t save money, you don’t pay anything. To see how much you could save while maintaining your performance standards, book a free cost audit with Hykell today.