Does your monitoring stack explain why your application is slow, or does it just confirm it’s down? For enterprise AWS users, the gap between “lagging” and “optimized” is measured in milliseconds and thousands in wasted compute. Here is how to build high-frequency telemetry that connects performance to outcomes.
Traditional observability often focuses on historical health, but real-time cloud performance analytics shifts the focus to high-frequency telemetry that connects technical bottlenecks directly to business outcomes. To maintain a competitive edge, DevOps and platform engineering teams must move beyond static dashboards toward architectures that process streams of performance data as they happen.
How real-time analytics differs from traditional observability
While traditional observability relies on the three pillars – metrics, logs, and traces – it often suffers from a “query-time” delay. You typically wait for an event to occur, wait for the agent to flush logs, and then wait for the indexer to make that data searchable. In a microservices environment, this 1-to-5-minute delay can lead to catastrophic cascading failures before you even receive an alert.
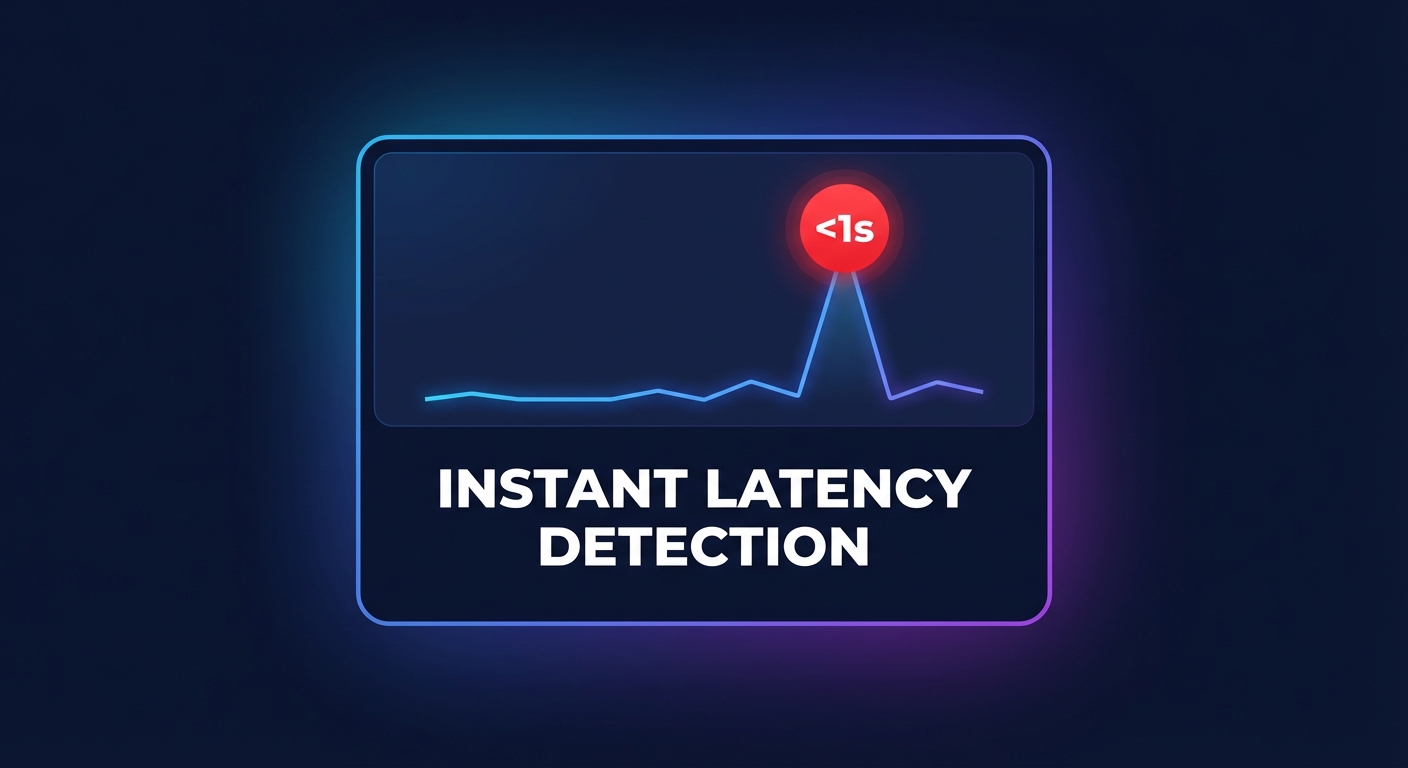
Real-time performance analytics treats performance data as a continuous stream rather than a series of snapshots. Instead of just knowing your Amazon EBS latency was high five minutes ago, real-time systems use event-driven architectures to detect anomalies in sub-second intervals. This shift allows your team to implement automated remediation – such as shifting traffic or scaling resources – before the end-user ever experiences a significant slowdown.
Architecting a real-time performance pipeline on AWS
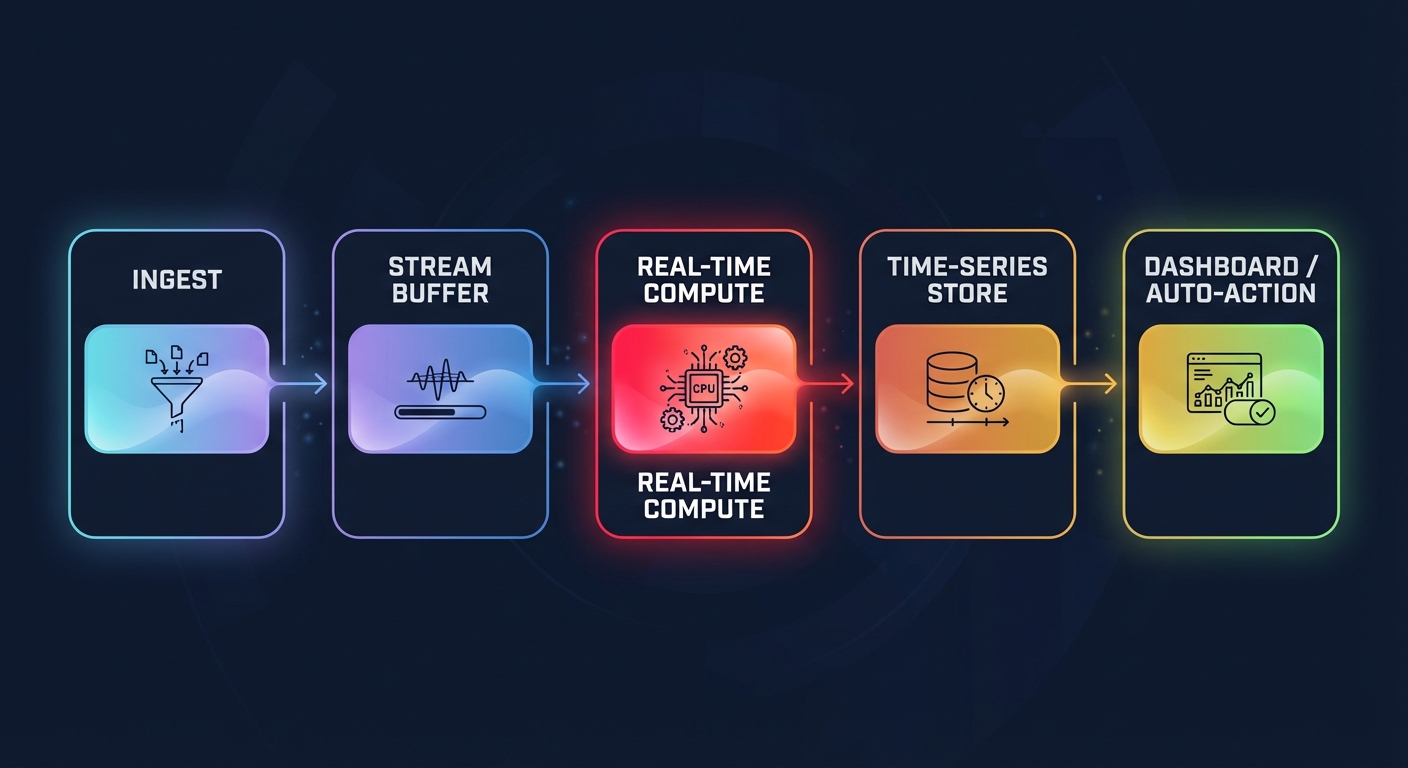
Building a robust analytics engine requires moving away from traditional polling and toward a streaming architecture. Modern AWS reference architectures for streaming focus on reducing the time between data generation and actionable insight. A standard implementation follows a specific lifecycle:
- Data Ingestion: You capture high-cardinality telemetry from EC2, EKS, and Lambda using services like Amazon Kinesis Data Streams or Amazon MSK.
- Stream Storage: Data is temporarily buffered within the stream to ensure no packets are lost during sudden traffic spikes or processing surges.
- Real-Time Processing: Managed Service for Apache Flink or AWS Lambda functions calculate rolling windows of p99 latency or error rates in mid-stream.
- Downstream Destinations: Processed metrics are delivered to high-performance time-series databases such as Amazon Timestream or Amazon OpenSearch Service for immediate retrieval.
- Visualization and Action: Real-time dashboards provide the interface for human intervention or serve as the source for automated scaling triggers.
By aggregating records before sending them to storage, you can maintain high-frequency visibility without ballooning your AWS CloudWatch logs pricing or creating unnecessary ingestion overhead.
Core tools for performance monitoring on AWS
To implement this architecture effectively, you should leverage a mix of native AWS services and specialized instrumentation. CloudWatch Application Signals automatically collects metrics and traces for distributed applications, allowing you to track Service Level Objectives (SLOs) without the burden of manual instrumentation. This provides a baseline of health that integrates directly into your broader delivery pipeline.
For more granular visibility, AWS X-Ray and the AWS Distro for OpenTelemetry (ADOT) are essential. You can instrument end-to-end tracing to follow a single request as it moves across Load Balancers, SQS queues, and RDS databases. Complementing this, CloudWatch Synthetics “canaries” simulate user journeys to detect performance degradation even during low-traffic periods, while AWS Compute Optimizer analyzes EC2 performance tuning data to recommend instance types that balance power with cost-efficiency.
Best practices for performance data implementation
Simply collecting data is not enough; you must ensure the telemetry is actionable for your engineering teams. Platform teams should prioritize the “Four Golden Signals” of monitoring: latency, traffic, errors, and saturation. These metrics provide a holistic view of system health that transcends individual service silos.
For database-heavy workloads, you should focus on AWS Aurora performance tuning by monitoring the Buffer Cache Hit Ratio and Volume Read IOPS. If these metrics drift from their established baseline, your analytics engine should trigger an alert before the application’s response time suffers.
Structuring your logging is equally critical for speed and cost. Using the Embedded Metric Format (EMF) allows CloudWatch to extract metrics from logs automatically, providing high-resolution data at a lower cost than traditional custom metrics. This technique is particularly useful for AWS RDS MySQL performance tuning, where slow query logs can be transformed into real-time performance signals that guide optimization efforts.
Connecting performance to AWS cost optimization
The ultimate goal of performance analytics is to achieve the highest possible output for the lowest possible spend. In many enterprise environments, performance issues are actually symptoms of resource misconfiguration. For instance, high disk queue depth might suggest you need to migrate from gp2 to gp3 volumes, which can improve performance by 20% while simultaneously lowering storage costs.
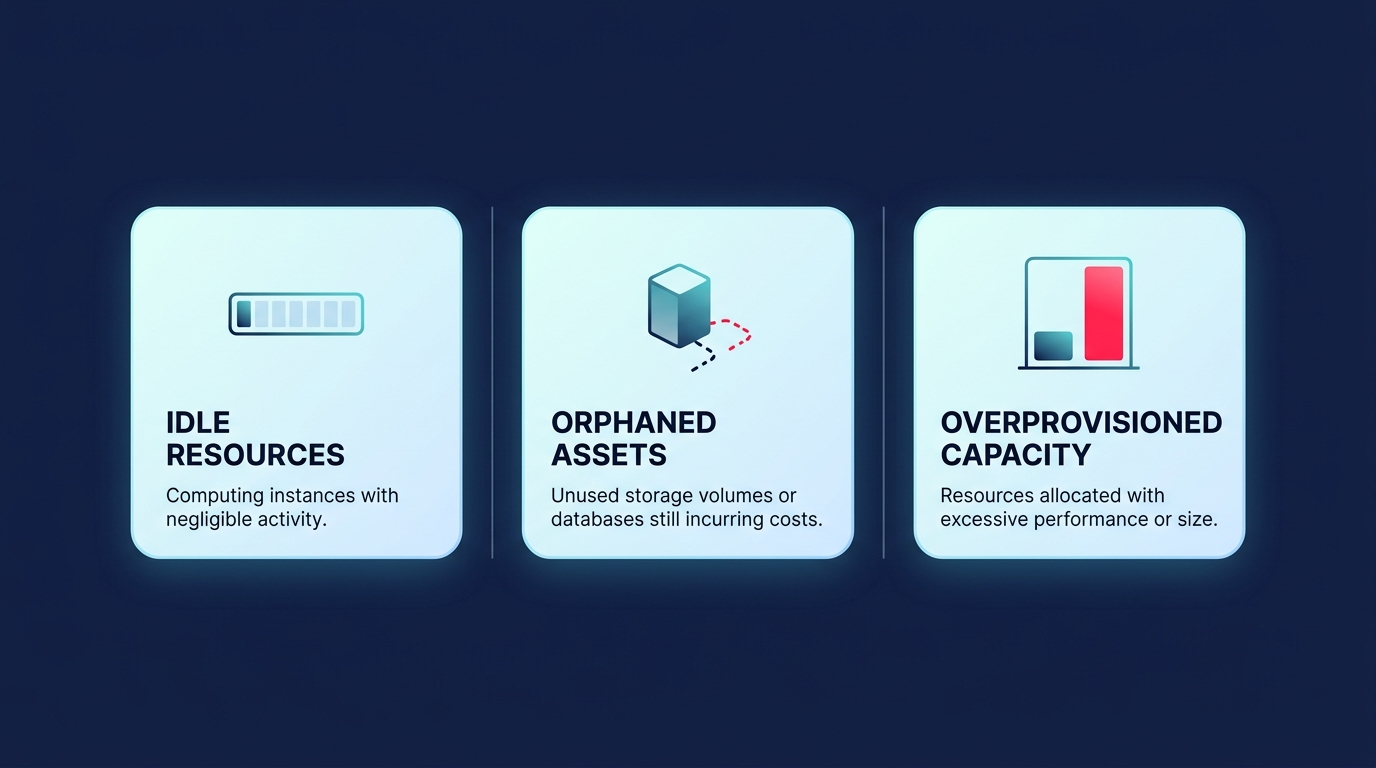
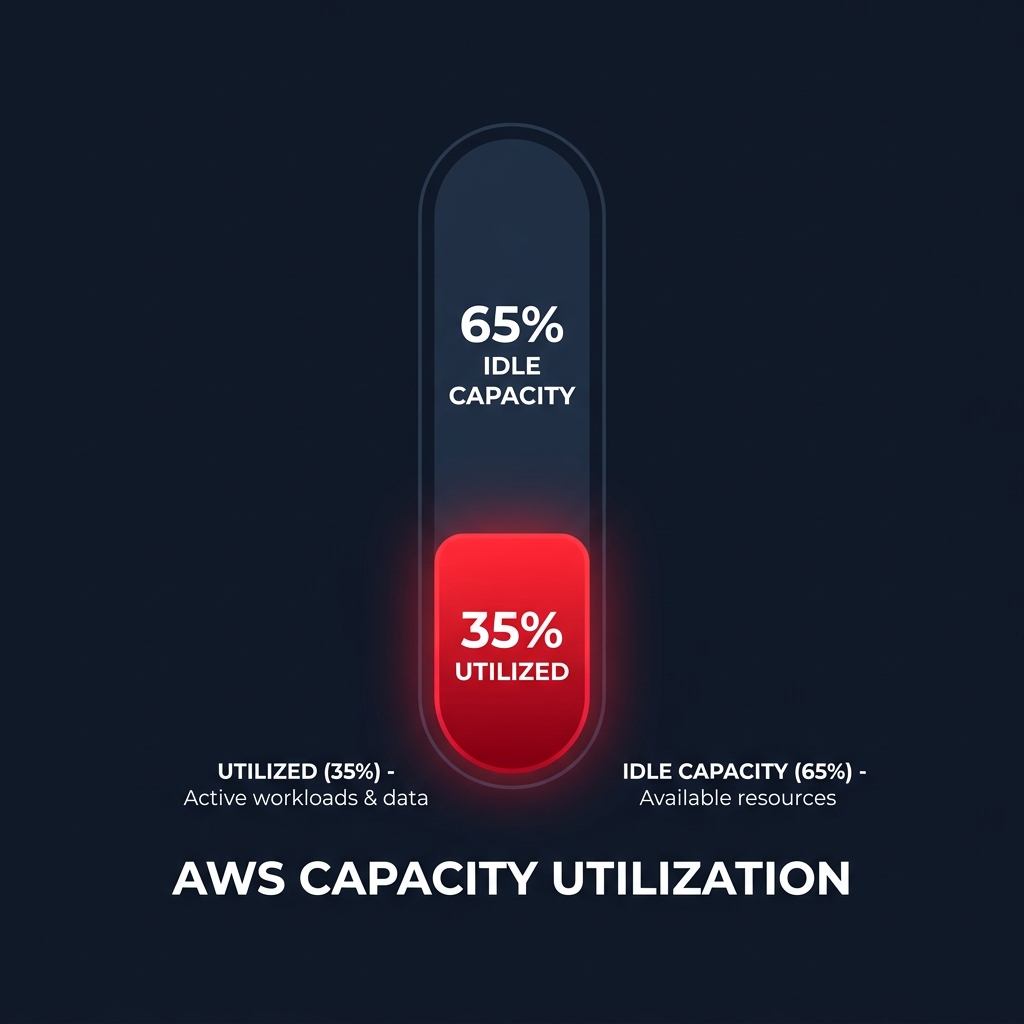
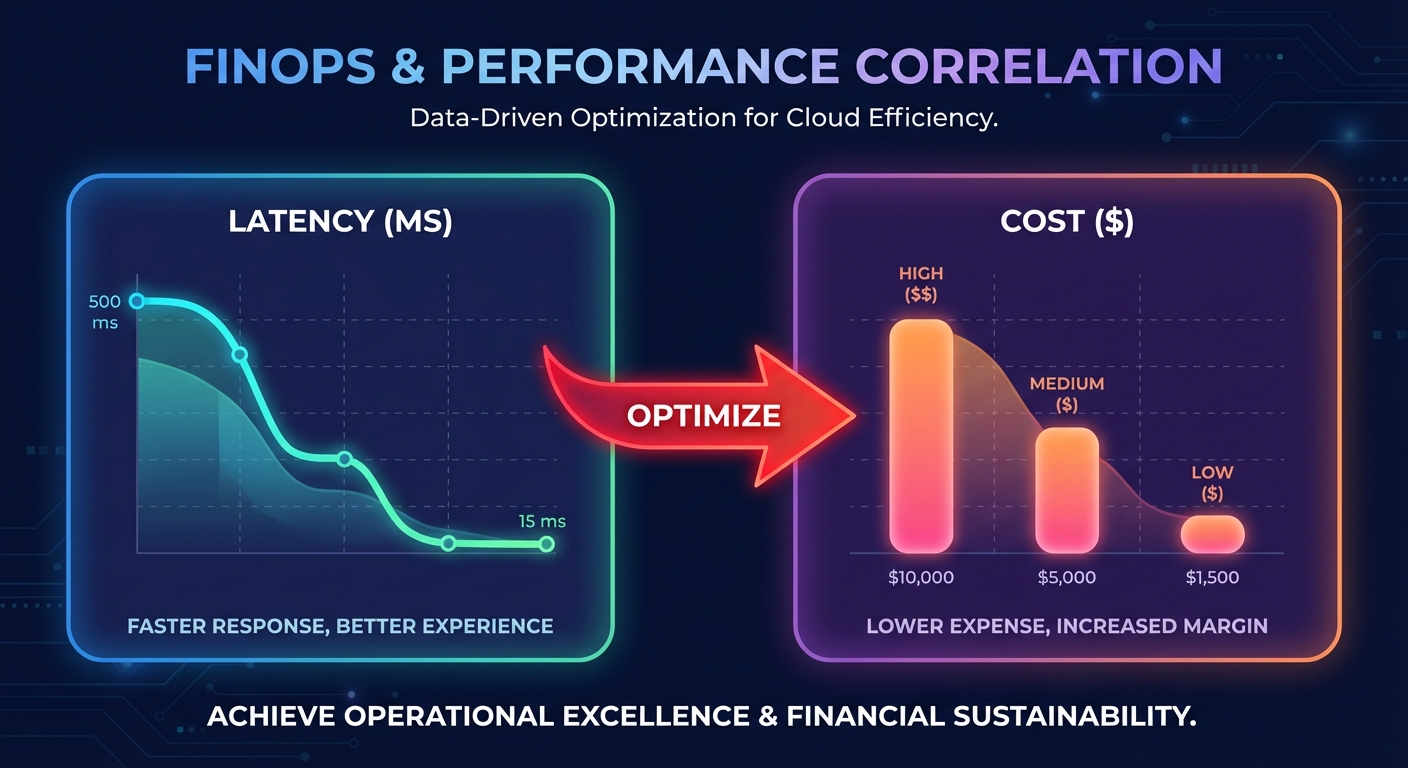
This is where the connection between performance monitoring and FinOps becomes critical. When you correlate real-time performance metrics with cost data, you can identify “zombie” resources or over-provisioned instances that aren’t contributing to application speed. Hykell bridges this gap by providing automated cloud cost optimization that works alongside your performance analytics.
Instead of manually reviewing AWS Cost Explorer reports to find savings, Hykell uses real-time usage data to execute rate optimizations and right-sizing on autopilot. By aligning your AWS Savings Plans and RIs with actual performance demands, you ensure that every dollar spent on AWS contributes to a faster, more resilient application.
Stop guessing whether your infrastructure is sized correctly for your performance goals. Connect your real-time analytics to automated action and reduce your AWS bill by up to 40% while maintaining peak application speed. You can calculate your potential savings today and see how Hykell puts your cloud efficiency on autopilot.