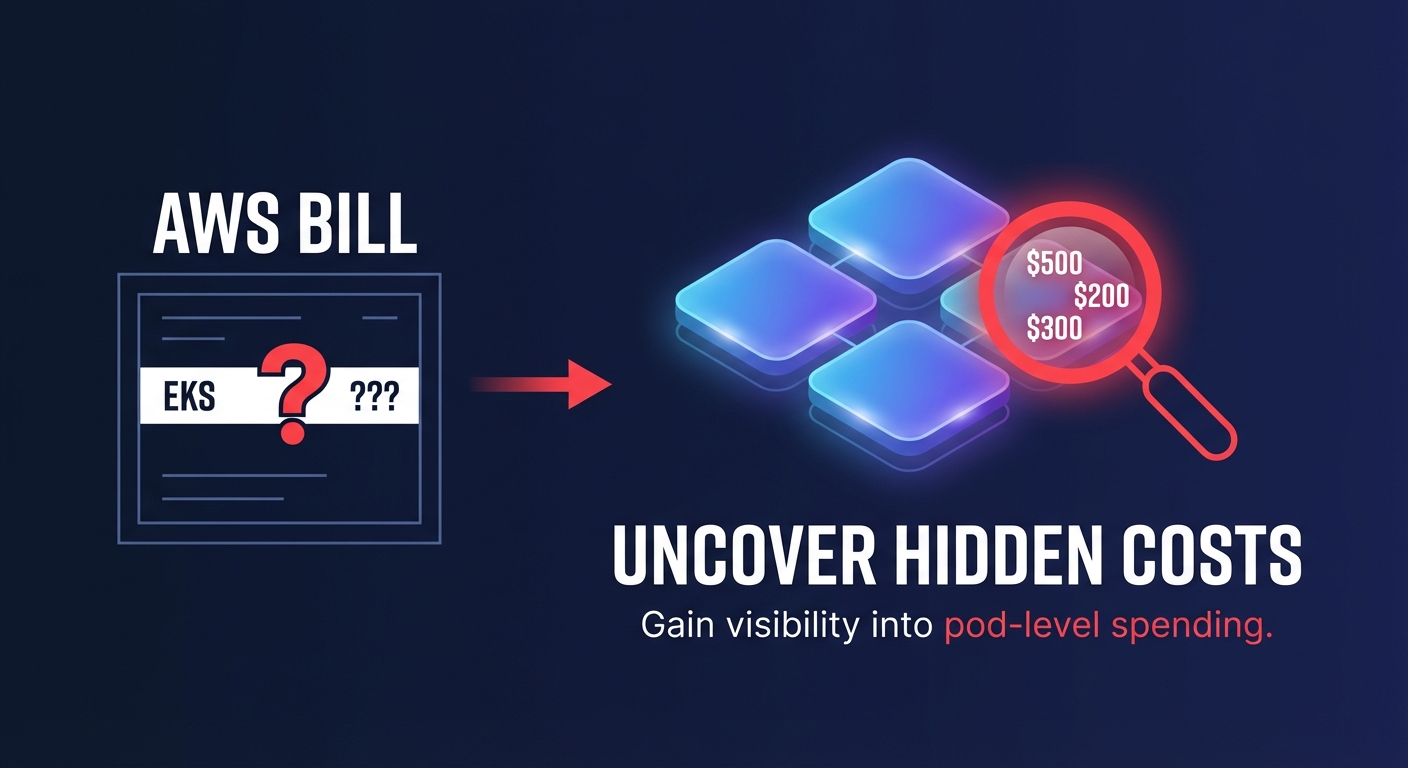
Does your AWS bill show a massive EKS line item but zero detail on which pod is burning your budget? Most engineering leaders struggle with this visibility gap until they integrate granular metrics into their Kubernetes cost optimization strategy.
The metrics engine: how Kubecost sees your EKS cluster
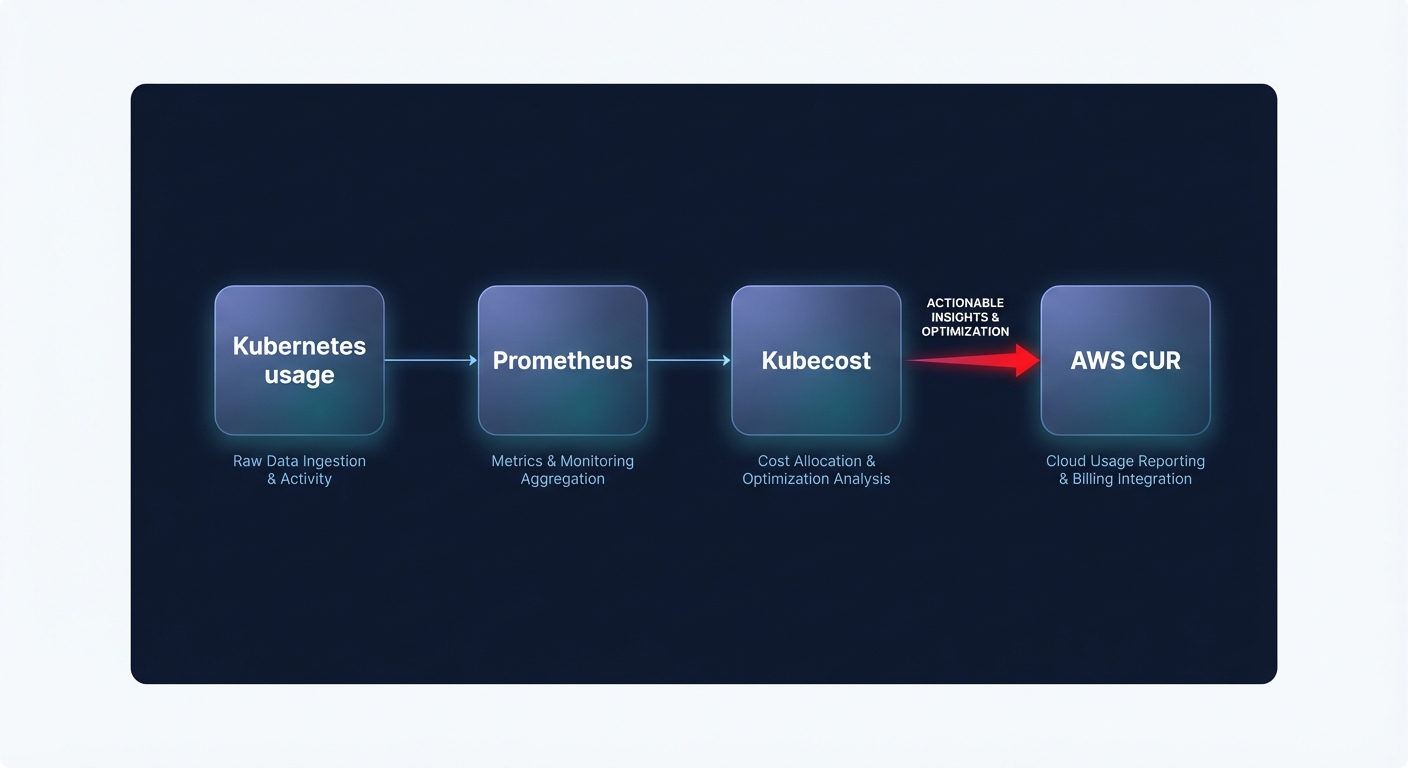
Kubecost acts as a financial microscope for your infrastructure, collecting raw telemetry from several specialized sources within your cluster. At its core, the system utilizes Prometheus to aggregate in-cluster metrics, including CPU, memory, storage, and network usage. This data is captured at the pod, namespace, and cluster levels to provide a comprehensive view of how your resources are actually being consumed.
To ensure high-fidelity reporting, Kubecost integrates with three primary Kubernetes metric sources. Kubernetes State Metrics (KSM) provide the essential status of objects like deployments and pods from the Kubernetes API, while cAdvisor collects container-specific resource usage and performance characteristics. Complementing these, the Node Exporter gathers hardware and OS-level metrics related to node usage. These streams undergo a rigorous ETL process that converts raw technical usage into actionable financial insights by mapping consumption directly to your specific AWS pricing tiers.
Mapping Kubernetes usage to the AWS Cost and Usage Report
Raw resource usage is only half of the equation; to determine true cost, the Kubecost AWS integration connects directly with AWS CloudWatch and the AWS Billing APIs. By ingesting your AWS Cost and Usage Report (CUR), Kubecost can reconcile estimated on-demand prices with your actual negotiated rates, including Enterprise Discount Programs (EDP).
This sophisticated mapping allows you to track costs at a level of detail that native tools often miss. Compute costs are allocated down to individual pods based on the specific EC2 instance type and its current pricing. Tracking persistent volume claims and storage class consumption helps identify EKS cost optimization opportunities, such as migrating from gp2 to gp3. Furthermore, the system monitors inbound and outbound data transfer costs between pods and other AWS services like S3 or RDS, while tracking how Savings Plans and Reserved Instances cover your cluster. This ensures your FinOps team understands the effective savings rate for all containerized workloads.
Automating optimization with real-time metric streams
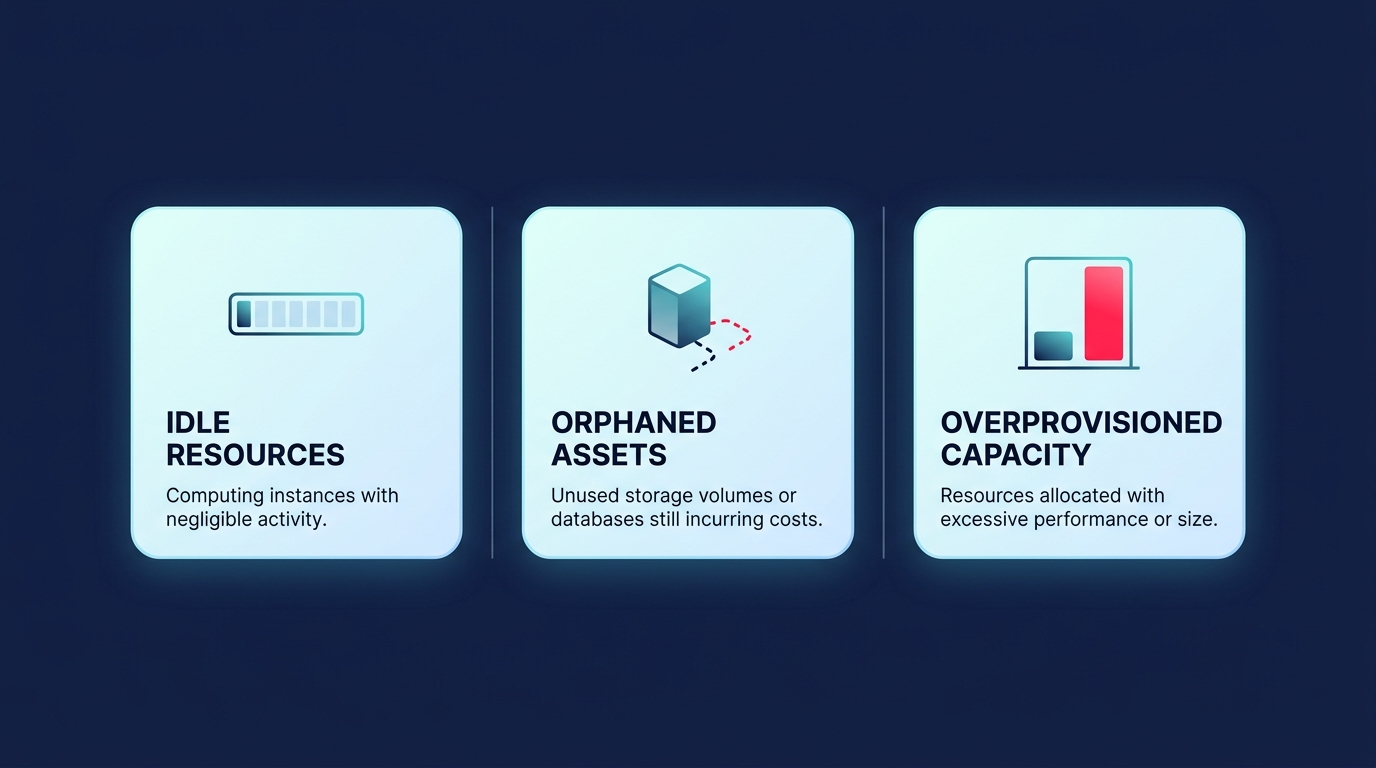
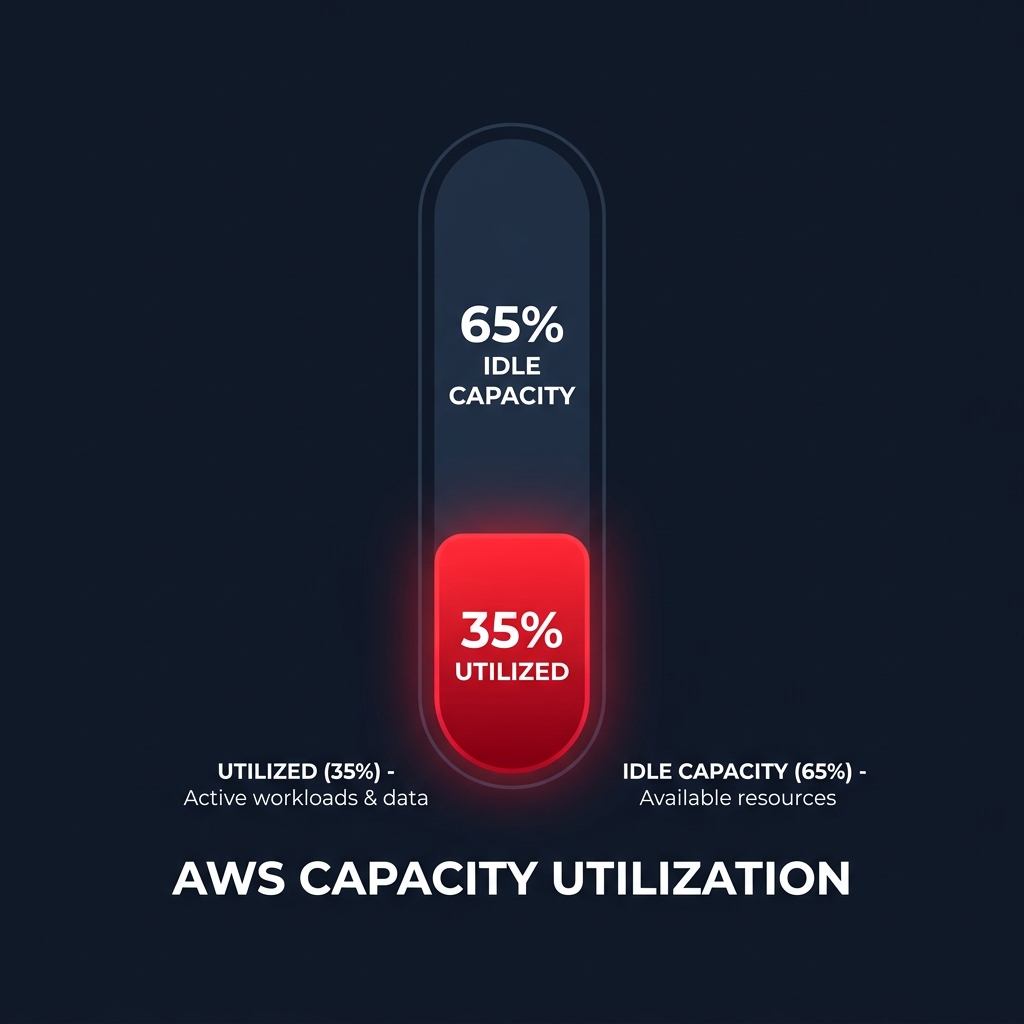
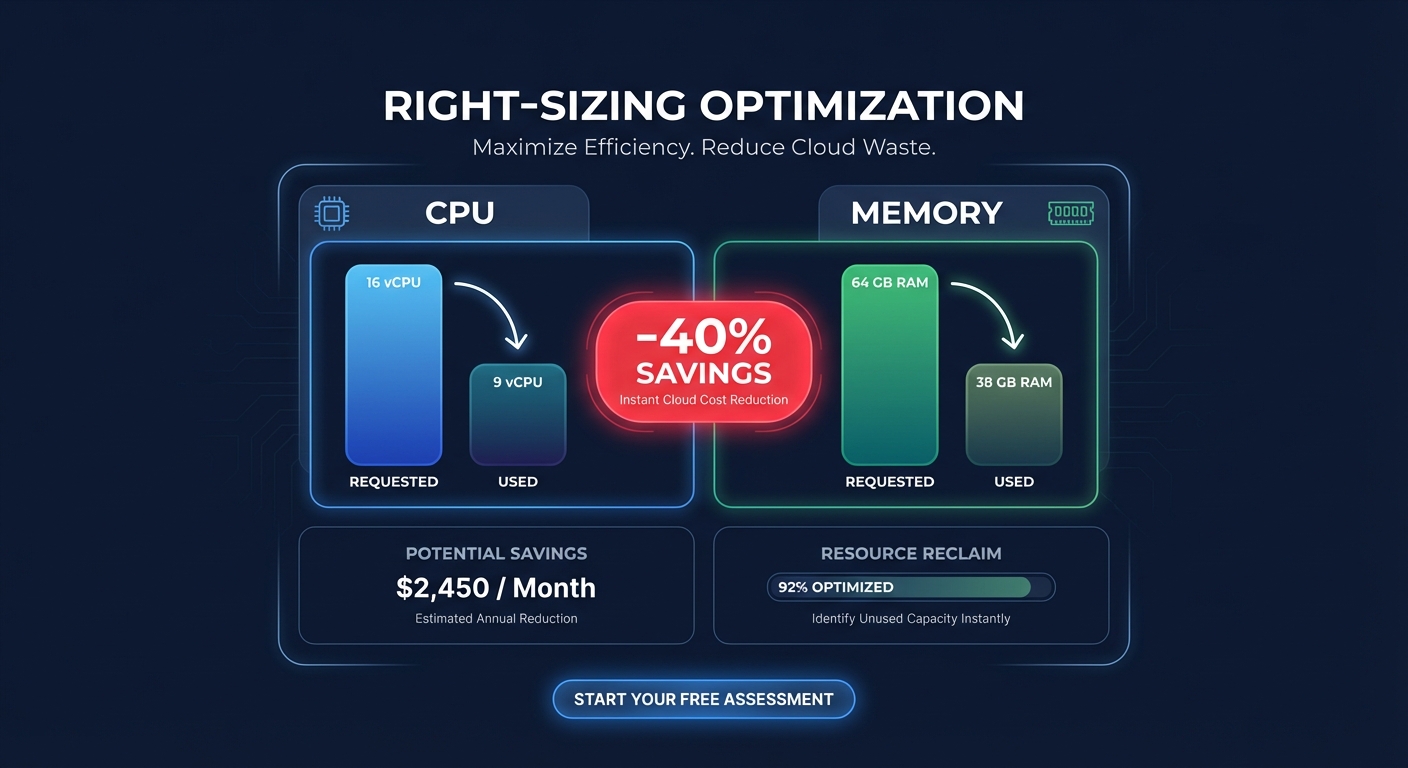
Once metrics are structured and mapped to AWS costs, they become the foundation for automated Kubernetes cost optimization. Hykell uses these real-time streams to identify over-provisioned workloads where actual usage is significantly lower than requested resources. Organizations typically see a 30-50% reduction in cluster costs through this type of automated resource right-sizing.
By comparing real-time metrics against historical baselines, Hykell can trigger dynamic request sizing, ensuring your pods have exactly what they need to perform without wasting expensive EC2 capacity. These metrics also help flag unused resources – such as idle pods, unattached EBS volumes, or empty nodes – which can account for up to 15% of total cloud spending. This transition from static monitoring to active, metric-driven scaling is what allows engineering teams to maintain performance while slashing waste.
Troubleshooting metric accuracy for high-fidelity FinOps
Missing or incorrect metrics are often the result of configuration gaps rather than software bugs. If your cost data seems inaccurate, the first place to look is your AWS cost allocation tags. Kubecost relies on consistent label-based attribution to organize costs by team, project, or business unit. Without these tags, your observability dashboard cannot properly attribute spend to the right stakeholders.
Beyond tagging, technical configuration issues can create data gaps that skew your financial reporting. You should verify the following areas to ensure data integrity:
- Data Latency: AWS CUR data often has a 24-hour delay, meaning newly launched services may not reflect final billing data immediately.
- IAM Permissions: The Kubecost service account must have specific permissions to query AWS Athena and CloudWatch to correlate out-of-cluster costs like RDS or S3.
- Prometheus Scraping: Verify that scrapers are reaching all nodes. High-churn environments or Spot instance interruptions can cause temporary telemetry gaps if your node provisioner is not properly configured.
Reliable metrics turn your Kubernetes infrastructure from a financial black box into a source of competitive advantage. By leveraging Hykell’s automated architecture, you can move beyond simple monitoring and begin implementing real-time optimizations that lower your AWS bill by up to 40% without any manual engineering effort. If you are ready to see how much you could be saving, Hykell offers a comprehensive cloud cost audit to uncover hidden waste and put your optimization on autopilot.