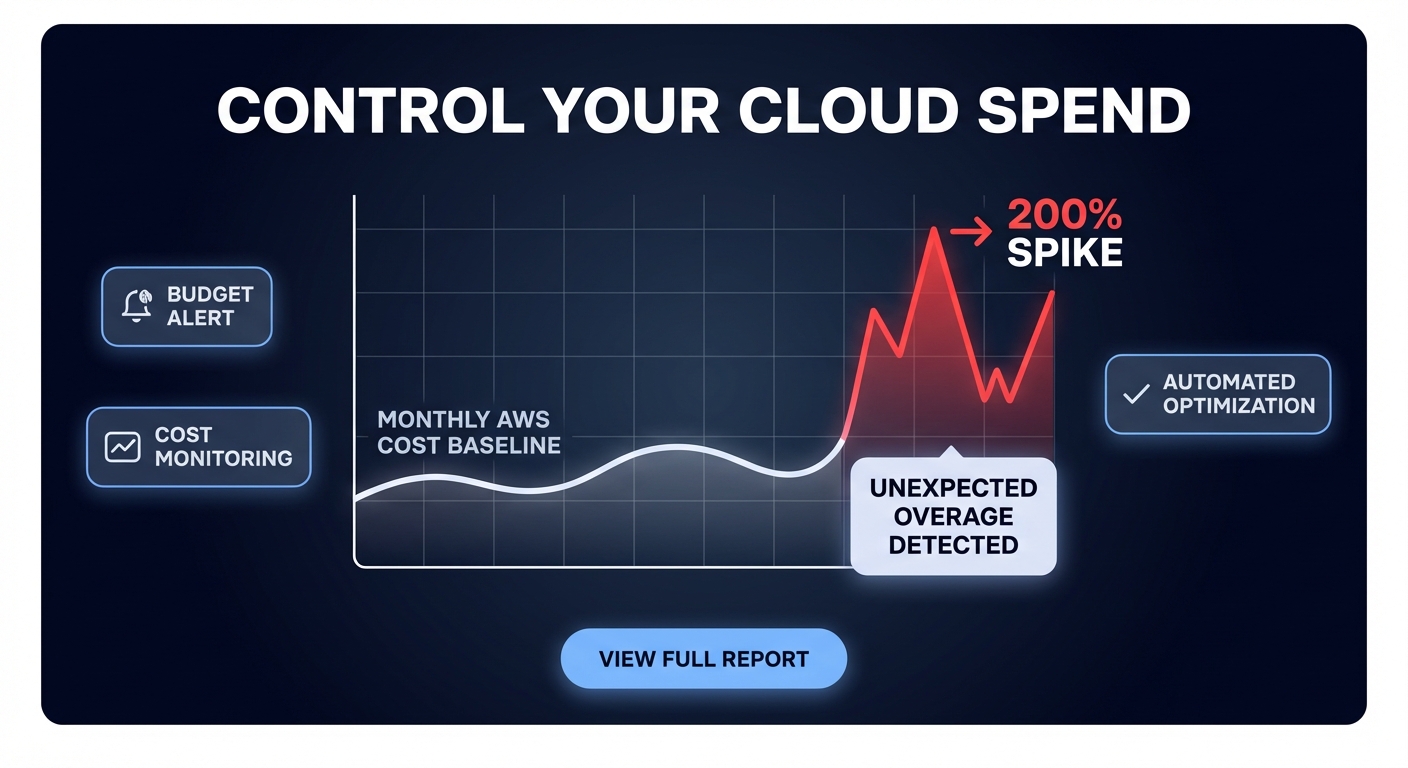
Could a single misconfigured Lambda function burn your entire monthly budget in a single afternoon? Without real-time visibility, you are often stuck waiting for an end-of-month invoice surprise to realize your costs have spiraled out of control.
AWS Cost Anomaly Detection uses machine learning to establish a baseline for your cloud spend and alert you when usage patterns deviate. Unlike static budgets, this service accounts for seasonality and organic growth, significantly reducing the noise that often plagues traditional alerting. However, simply turning it on is rarely sufficient; you need a proactive strategy to operationalize these alerts into a comprehensive cloud cost governance framework.
How AWS Cost Anomaly Detection works
The service functions by analyzing your historical spend to create a dynamic baseline, typically requiring at least two months of data for optimal accuracy. It processes your billing data roughly three times a day, searching for anomalies across specific dimensions. As of March 2023, AWS automatically enables this for new Cost Explorer customers with a default service-level monitor, but sophisticated environments require more granular configurations.
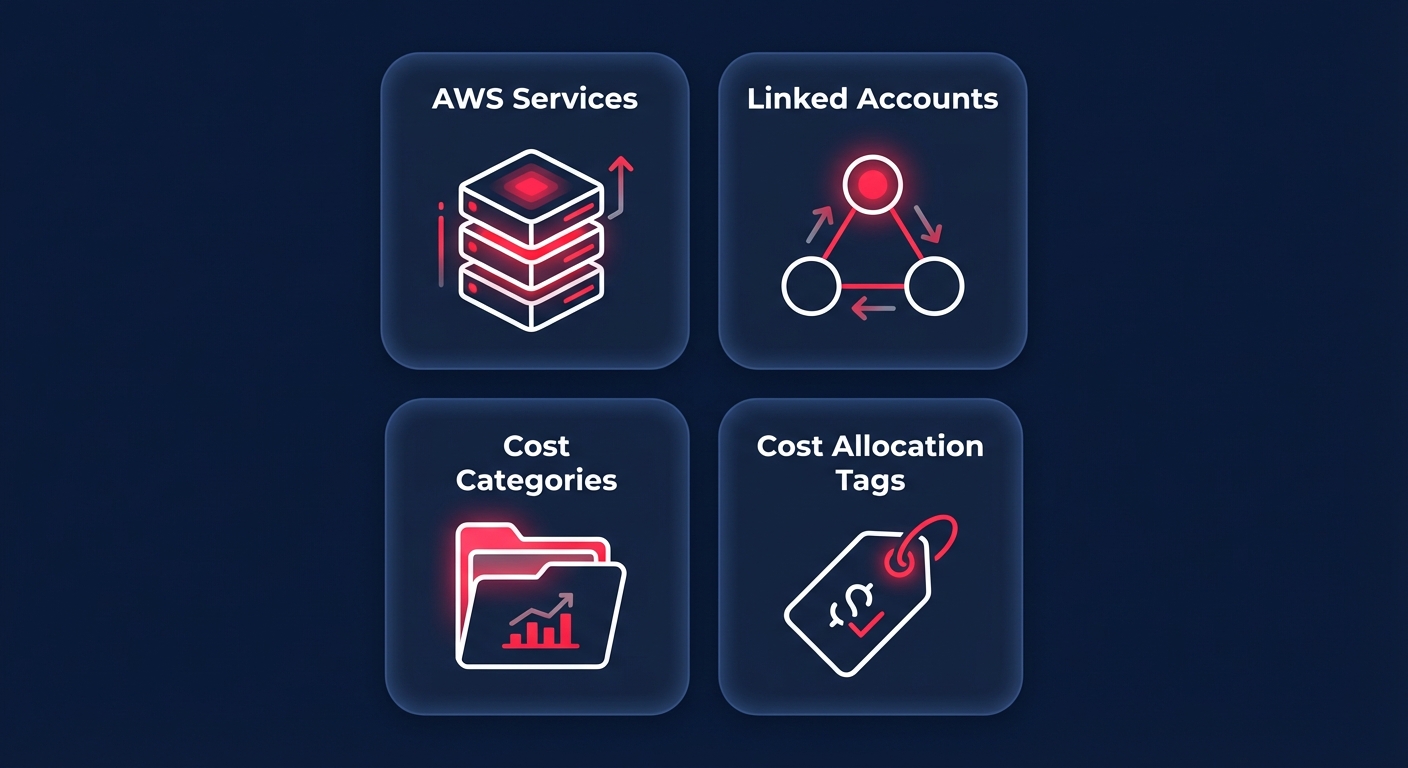
When you configure the service, you choose from four primary monitor types:
- AWS Services: A broad monitor that tracks every service in your account to catch overall spend shifts.
- Linked Accounts: Identifies specific member accounts within an organization that are driving unexpected costs.
- Cost Categories: Tracks custom groupings of costs, such as specific departments or business units.
- Cost Allocation Tags: The most granular option, allowing you to monitor resources with specific metadata like environment or project IDs.
For teams managing infrastructure at scale, implementing AWS Cost Anomaly Detection with Terraform is the most efficient way to ensure these monitors are consistently deployed and version-controlled across a multi-account environment.
Setting up effective alerting policies
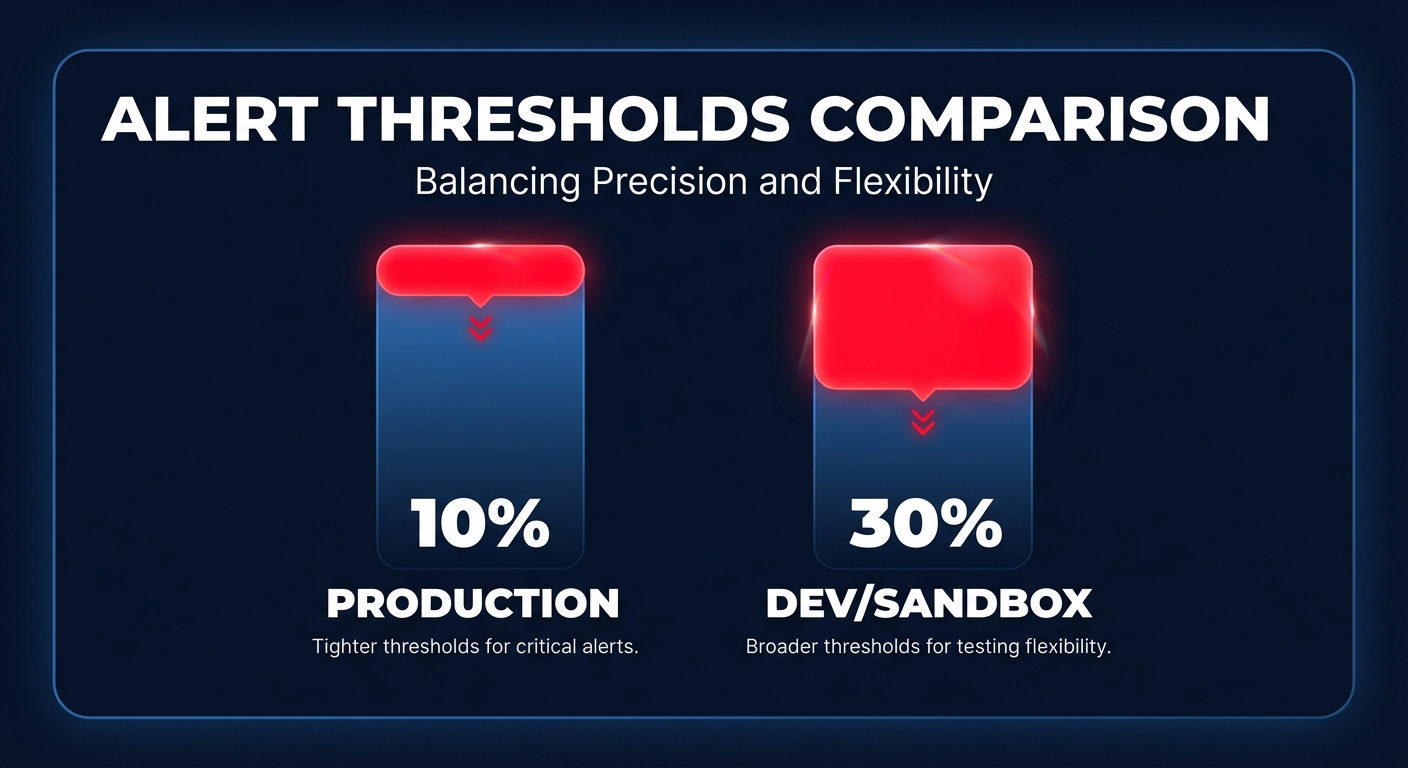
The difference between a useful alert and alert fatigue lies in your threshold configuration. Production environments are typically more stable and require higher sensitivity; a common best practice is to set production alerts at 10% above historical averages. In contrast, development or sandbox environments are experimental and prone to volatility. Setting a looser threshold of 30% ensures you only get notified for genuine runaway resources rather than routine feature testing.
By default, some monitors might send daily or weekly summaries, which can be too slow for high-spend workloads. For critical systems, you must set the notification frequency to immediate. This ensures that as soon as the machine learning model flags a deviation, an alert is sent via email or an Amazon SNS topic. Integrating these alerts with Slack or PagerDuty allows your engineering team to react before a minor drift becomes a financial disaster.
A structured investigation playbook
When an alert hits your inbox, speed is your most valuable asset. Having a documented workflow prevents panic and ensures you identify the root cause accurately before the spend compounds.
You should first assess the impact by reviewing the impact percentage and total dollar amount in the alert. A 5% drift may be an organic growth trend, but a 300% spike requires immediate intervention. Once you understand the scale, use AWS Cost Explorer to filter by the service and region identified. Switching to hourly granularity for the last 14 days allows you to pinpoint the exact moment the spend began to climb.
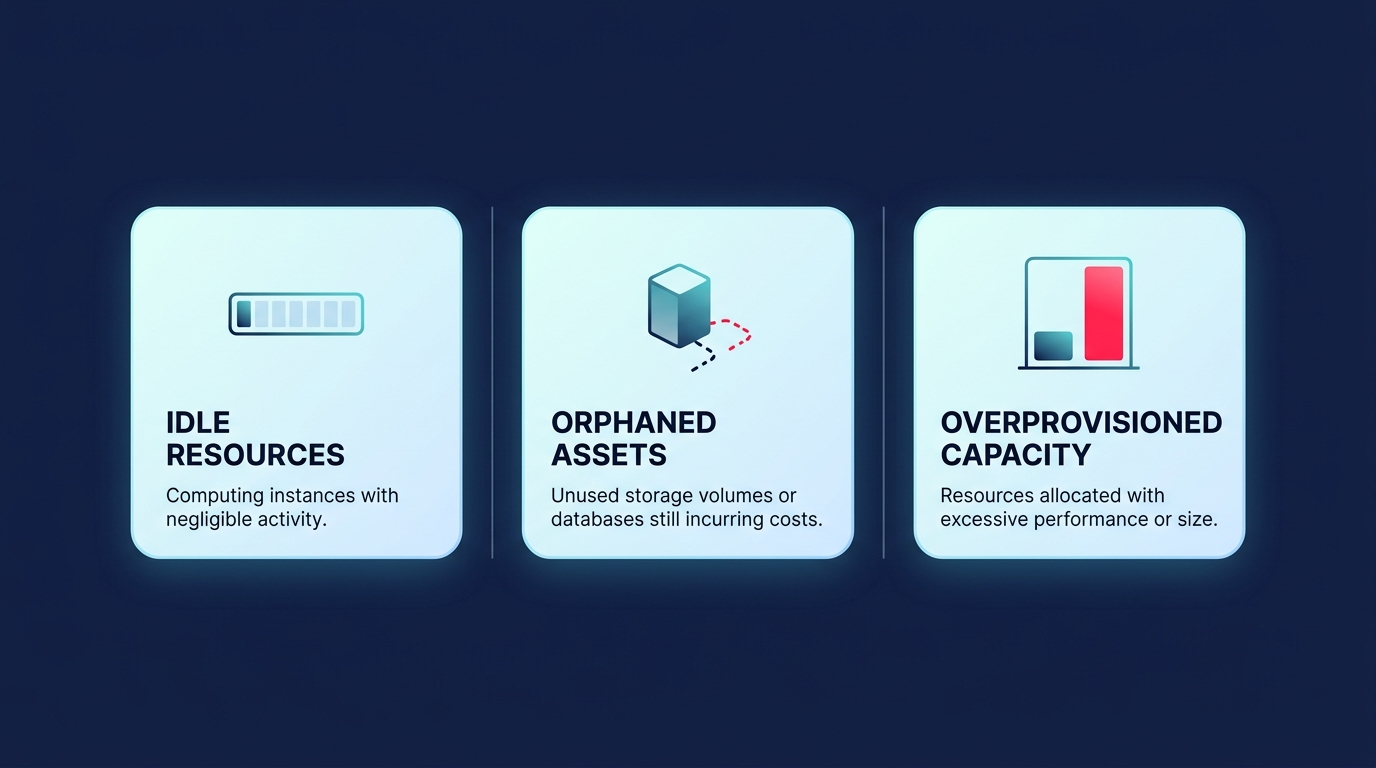
Next, correlate the spike timing with AWS CloudWatch application monitoring and CloudTrail logs. You are looking for specific API calls, such as resource launches or volume creations, that coincide with the cost increase. Finally, use AWS cost allocation tags to find the specific resource ID responsible for the anomaly. Spikes are often driven by orphaned EBS volumes left behind after instance termination or improper shutdown procedures in non-production environments.
Limitations of the native AWS service
While the native service is a powerful starting point, it has several gaps that engineering leaders must account for. Detection latency is a primary concern, as there is a typical 2-24 hour delay between a resource being launched and an anomaly being detected. In high-velocity environments, thousands of dollars can be wasted during this processing window compared to third-party tools that can achieve 5-15 minute detection.
Furthermore, the service is strictly observational; it identifies the “fire” but does not provide an extinguisher. Your team must still manually implement remediation, such as terminating resources or rightsizing instances. Native machine learning models are also better at spotting sudden spikes than “cost creep” – gradual increases like a database growing from 100GB to 500GB over six months – which may never trigger a threshold. Finally, granular monitoring is entirely dependent on your automated tagging for AWS cost allocation. If a resource is launched without tags, it falls into an unallocated bucket, making investigation significantly more difficult.
Closing the loop with Hykell
Native tools provide the visibility you need to start, but they often leave your engineers stuck in a cycle of manual investigation. Hykell extends these controls by moving from reactive alerting to proactive, automated optimization. While AWS identifies that an EC2 instance is costing too much, Hykell can facilitate automated EC2 rightsizing to implement changes on autopilot.
If an anomaly is caused by inefficient storage, Hykell’s automated EBS optimization can transition volumes to more cost-effective tiers like gp3 without impacting performance. Instead of your team spending hours digging through logs, Hykell provides a cloud observability dashboard tailored to your specific role, whether you are a CFO tracking high-level KPIs or a DevOps lead managing compute anomalies.
By combining machine-learning detection with automated execution, you can reduce your total AWS spend by up to 40% without the ongoing engineering lift. Hykell operates on a performance-based model, meaning you only pay a slice of the savings we actually deliver. You can use our automated cloud cost management platform to identify where your budget is leaking and schedule a cloud cost audit to eliminate anomalies before they appear on your invoice.