Are you overspending on AWS by 30% because of invisible performance bottlenecks? Understanding the link between resource metrics and your monthly bill is the first step toward reclaiming your budget without sacrificing application speed or reliability.
The four golden signals of AWS performance
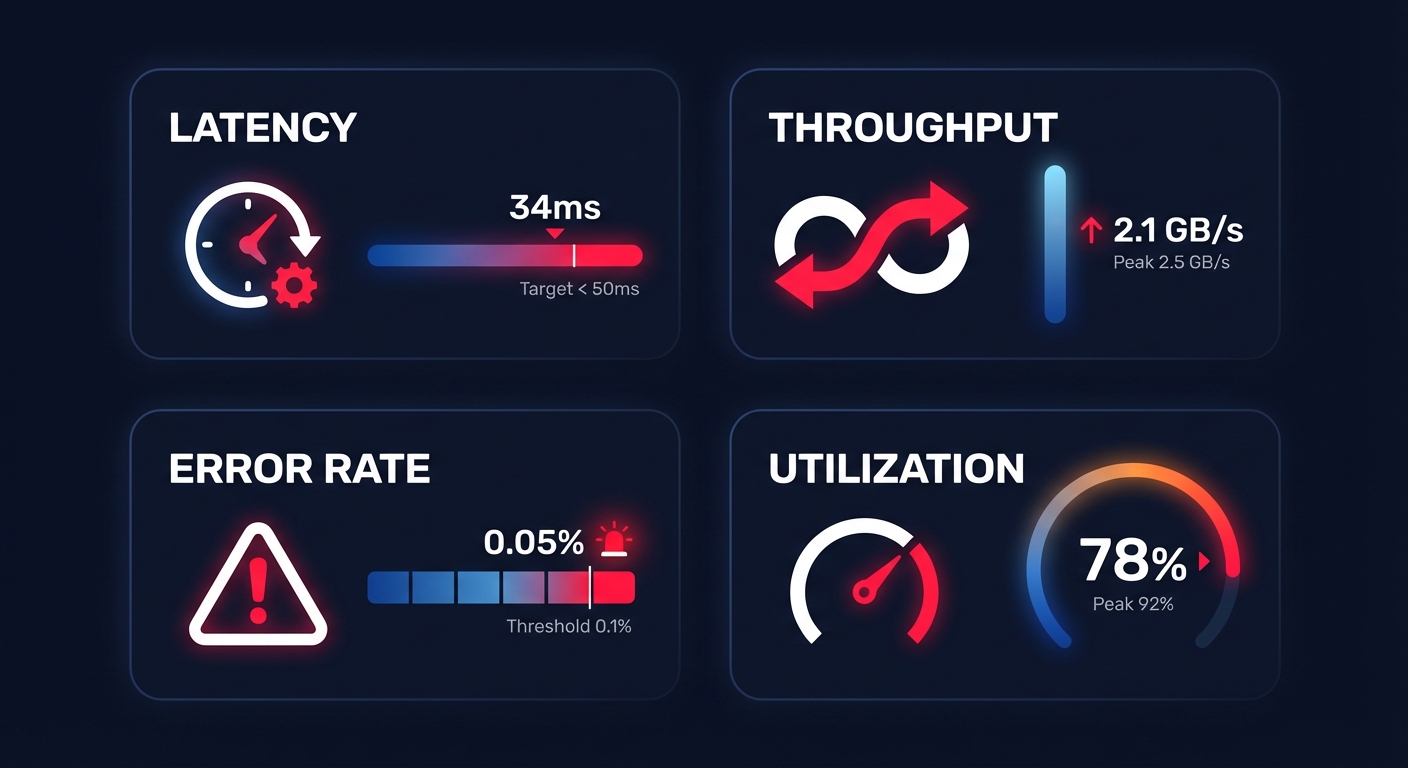
Maintaining a healthy cloud performance monitoring strategy requires you to track more than just a “green” status on a dashboard. For AWS-focused teams, performance is defined by four critical pillars that dictate both the user experience and the monthly invoice.
Latency and the user experience
Latency measures the time it takes for a request to be serviced, and in the AWS ecosystem, this often manifests as Amazon EBS latency or network response times. Your requirements will vary significantly based on your workload; while standard web transactions should target a range of 0–100ms, real-time trading platforms may require sub-5ms latency at the 99th percentile to remain competitive. Monitoring average latency is rarely enough, as tail latency often hides the true source of user frustration.
Throughput and data volume
Throughput represents the amount of data transferred per second, typically quantified in MB/s or MiB/s. For storage-heavy tasks, AWS EBS throughput is the defining metric for ETL and batch processing jobs. You should specifically watch the `VolumeThroughputPercentage` metric; if this value approaches 100%, your volume has reached its saturation point. At this stage, any additional I/O requests will queue, causing an inevitable spike in latency that ripples through your entire application stack.
Error rates and reliability
Tracking reliability involves more than just uptime; you must monitor HTTP 5XX codes on your Load Balancers and execution failures within your Lambda functions. As a general rule of thumb, an error rate exceeding 5% over a sample of 50 requests warrants an immediate investigation. By correlating these error spikes with performance data, you can quickly distinguish between application-level bugs and underlying infrastructure bottlenecks.
Resource utilization and efficiency
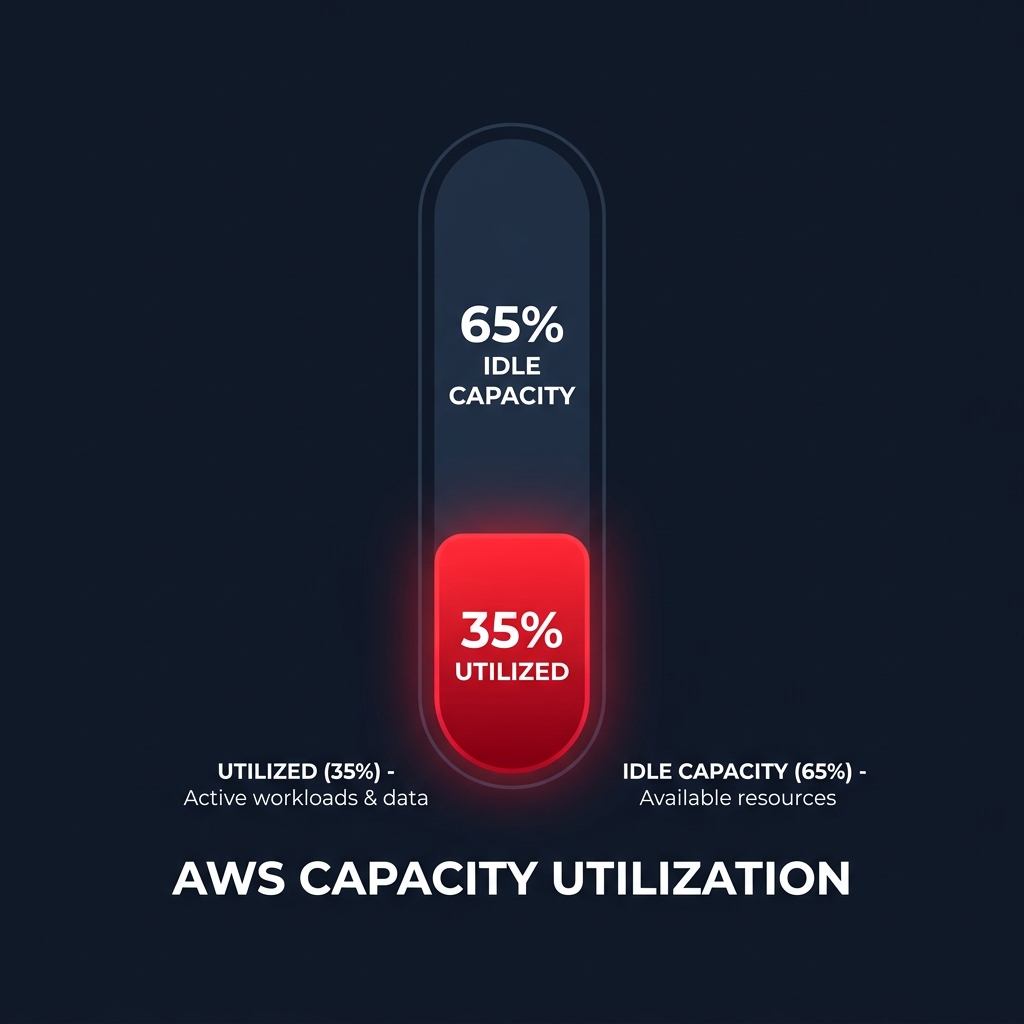
Efficiency is the point where performance meets cloud resource utilization analysis. While running at 80% CPU utilization might appear cost-effective, it leaves your system with dangerously little headroom for sudden traffic spikes. Conversely, if your instances consistently report less than 40% CPU usage, they are prime candidates for cloud resource right-sizing. Identifying these oversized resources allows you to reduce waste without impacting the stability of your production environment.
How to monitor performance with concrete commands
While the AWS Management Console offers a high-level overview, engineering teams require programmatic access to metrics to build robust AWS application performance monitoring workflows. Using the CLI and CloudWatch Logs Insights provides the granularity needed to identify silent killers like I/O wait times and memory exhaustion.
Checking EBS I/O performance via CLI
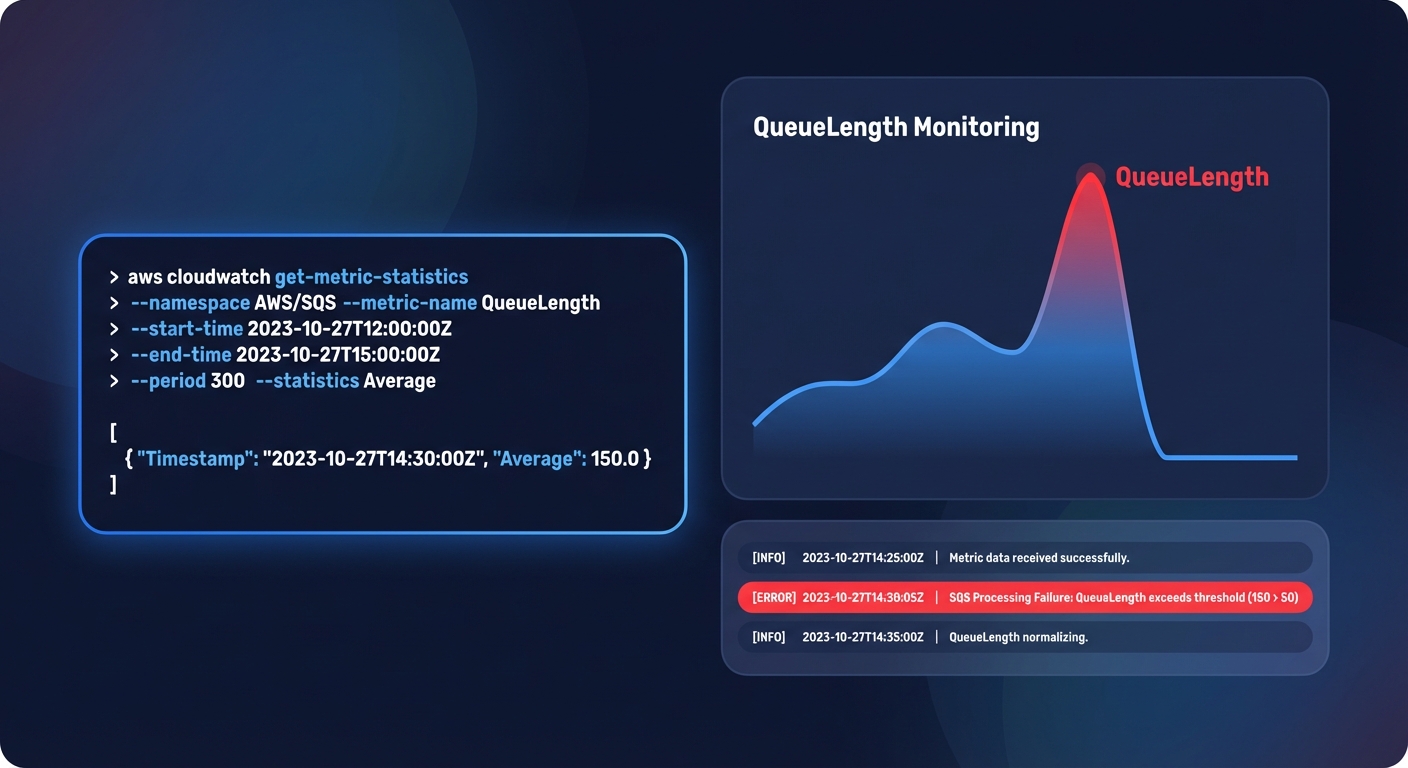
To determine if an EBS volume is throttling your application, you can pull the `VolumeQueueLength` directly from CloudWatch. For SSD-backed volumes like gp3, a queue length consistently above 10 indicates that your application is issuing I/O requests faster than the volume can process them. You can use the following command to audit your volume performance over a specific period:
“`bash
aws cloudwatch get-metric-statistics
–namespace AWS/EBS
–metric-name VolumeQueueLength
–dimensions Name=VolumeId,Value=vol-0123456789abcdef
–statistics Average
–start-time 2023-10-01T00:00:00Z
–end-time 2023-10-01T01:00:00Z
–period 300
“`
Analyzing logs with CloudWatch Insights
For deep-dive AWS CloudWatch application monitoring, Logs Insights is the most efficient tool for pinpointing latent API endpoints. By querying your logs, you can identify the specific requests that exceed your performance thresholds. The following query helps you isolate the top 20 requests that take longer than one second to complete:
“`sql
fields @timestamp, @message, @duration
| filter @duration > 1000 |
| sort @duration desc |
| limit 20 |
“`
Monitoring memory usage
It is important to remember that standard EC2 metrics do not include memory utilization by default. To track this, you must install the Unified CloudWatch Agent to push `memusedpercent` to your dashboard. This step is non-negotiable for effective rightsizing, as many modern workloads are memory-bound rather than CPU-bound, and optimizing based on CPU alone can lead to performance regressions.
Tying performance to cost-aware optimization
In a modern FinOps environment, performance metrics serve as the primary evidence for cloud cost auditing. You cannot safely optimize what you do not accurately measure. For example, migrating storage from gp2 to gp3 can reduce your costs by approximately 20% while providing more consistent baseline performance, but this move requires a precise understanding of your actual throughput and IOPS requirements.
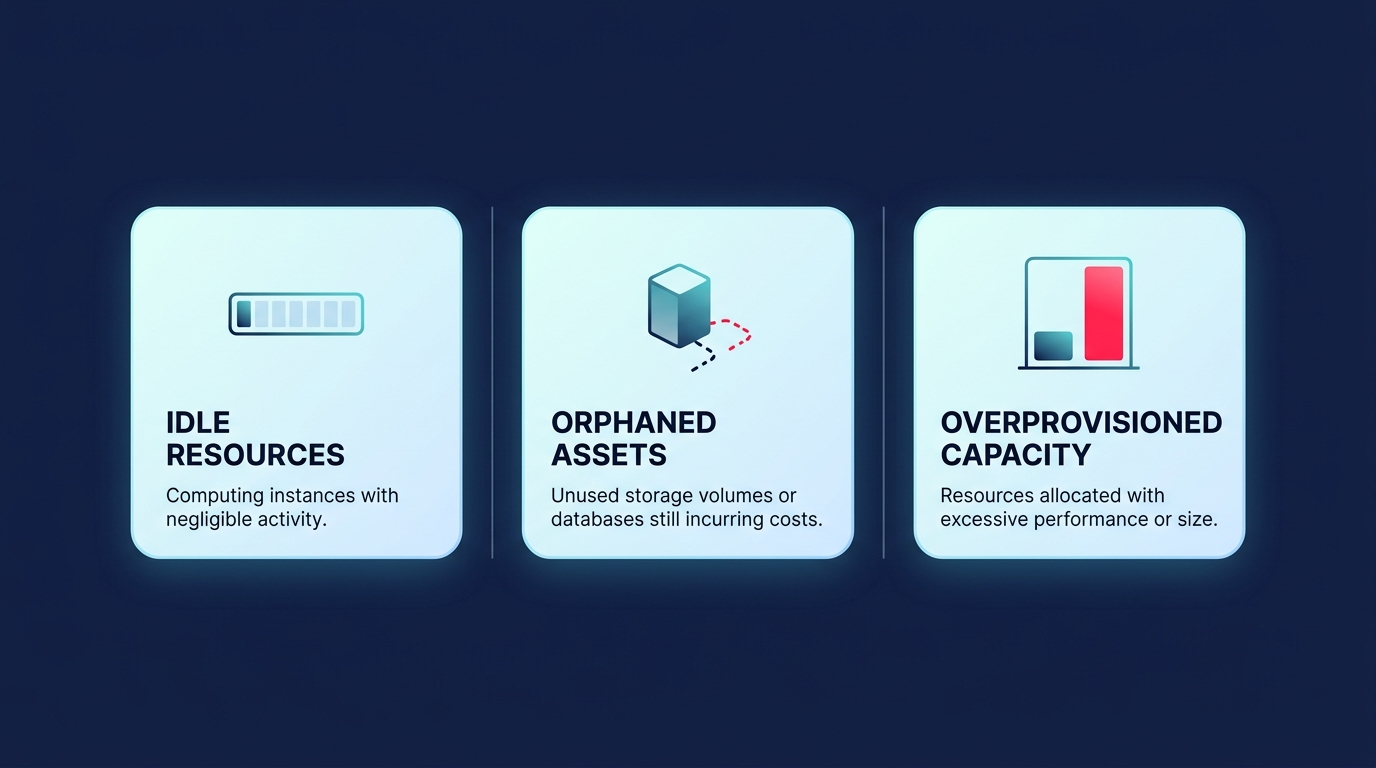
Many teams find this balance difficult to maintain, especially as 68% of FinOps responsibilities now fall directly on engineering roles. This “observability tax” often diverts valuable time away from feature development. Effective AWS ec2 performance tuning requires constant vigilance, such as watching for burst credit depletion on T-series instances or identifying orphaned EBS snapshots that bloat your bill without providing any operational value.
Automating the price-performance tightrope with Hykell
Maintaining peak performance while slashing costs should not require hundreds of manual engineering hours every month. Hykell bridges the gap by utilizing your real-time performance data to drive automated AWS rate optimization and infrastructure rightsizing. This approach ensures your savings strategies are always backed by the actual demands of your workloads.
While native tools like AWS Compute Optimizer provide helpful recommendations, Hykell goes further by executing optimizations on autopilot. By analyzing your actual CPU, memory, and I/O usage, Hykell can reduce your AWS costs by up to 40% without compromising the reliability or speed of your critical applications. This ensures you only pay for the performance you actually use, leaving the complex management of commitments and instance selection to intelligent automation.
Stop guessing your resource requirements and start optimizing with precision-engineered data. Book a free cost audit with Hykell today to see exactly where your infrastructure is over-provisioned and how much you could save.