Does your infrastructure struggle to keep pace with rapid traffic spikes? Choosing between AWS and Azure requires a deep dive into millisecond latency, IOPS floors, and CPU throughput to ensure your applications remain responsive while your cloud budget stays under control.
Benchmarking compute and memory performance
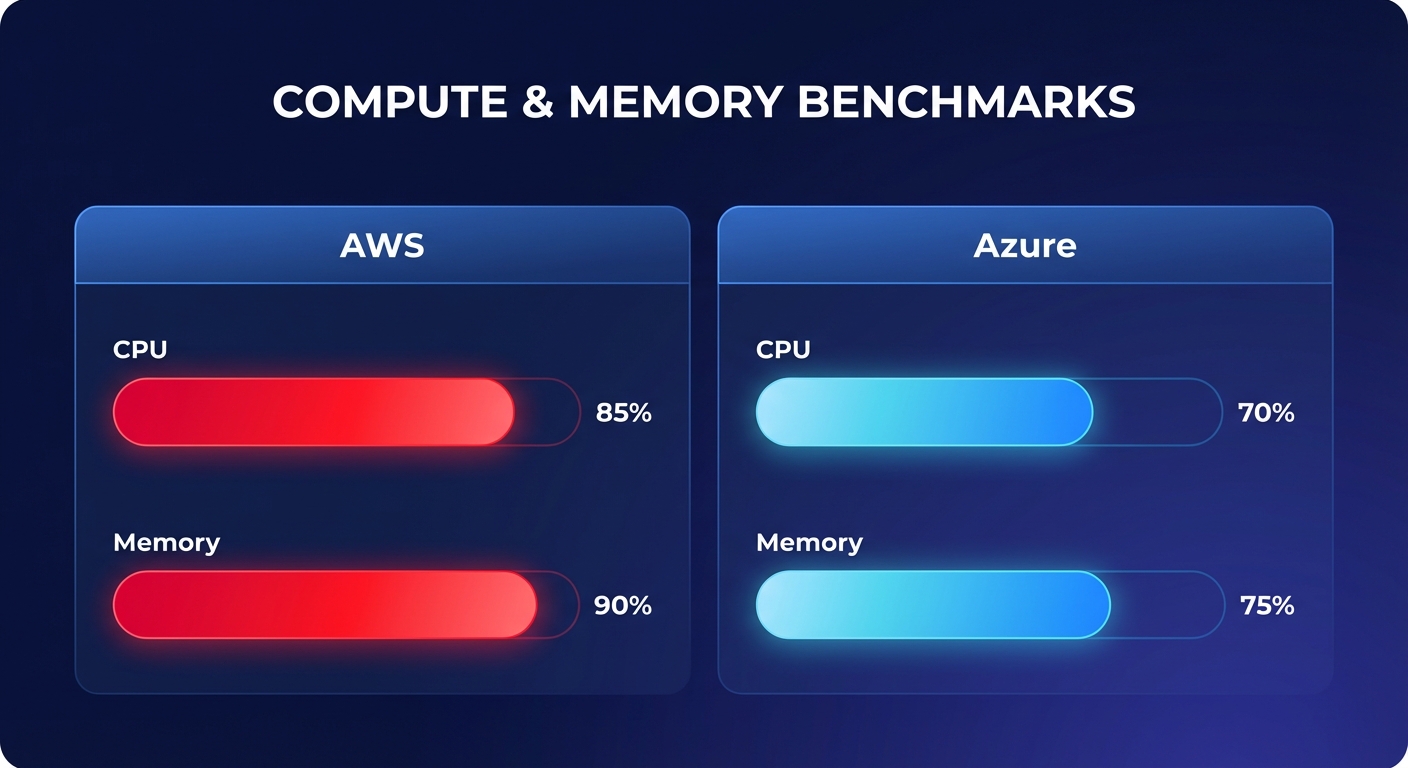
Third-party performance studies reveal a distinct divide between the two giants. In comprehensive evaluations of cloud performance benchmarking, AWS frequently secures the top spot for raw compute power. Research from CloudSpectator indicates that AWS wins in seven out of ten categories for CPU and memory performance, showing particular strength in multi-core scenarios that drive compute-intensive applications.
While Azure is often the go-to for Microsoft-centric enterprises, its strengths lie in specialized storage interactions rather than raw sequential speed. For example, Azure excels in 4K random read/write operations at approximately 27.53 MB/s. In contrast, AWS leads the way for engineering teams handling massive data transfers or sequential workloads, recording sequential write speeds of 46.25 MB/s. When comparing cloud performance providers, it becomes clear that selecting the right instance requires balancing these specific metrics. To maintain this edge, many architects employ AWS EC2 performance tuning to ensure their virtual machines are optimized for their specific memory and CPU requirements.
Reliability and global availability standards
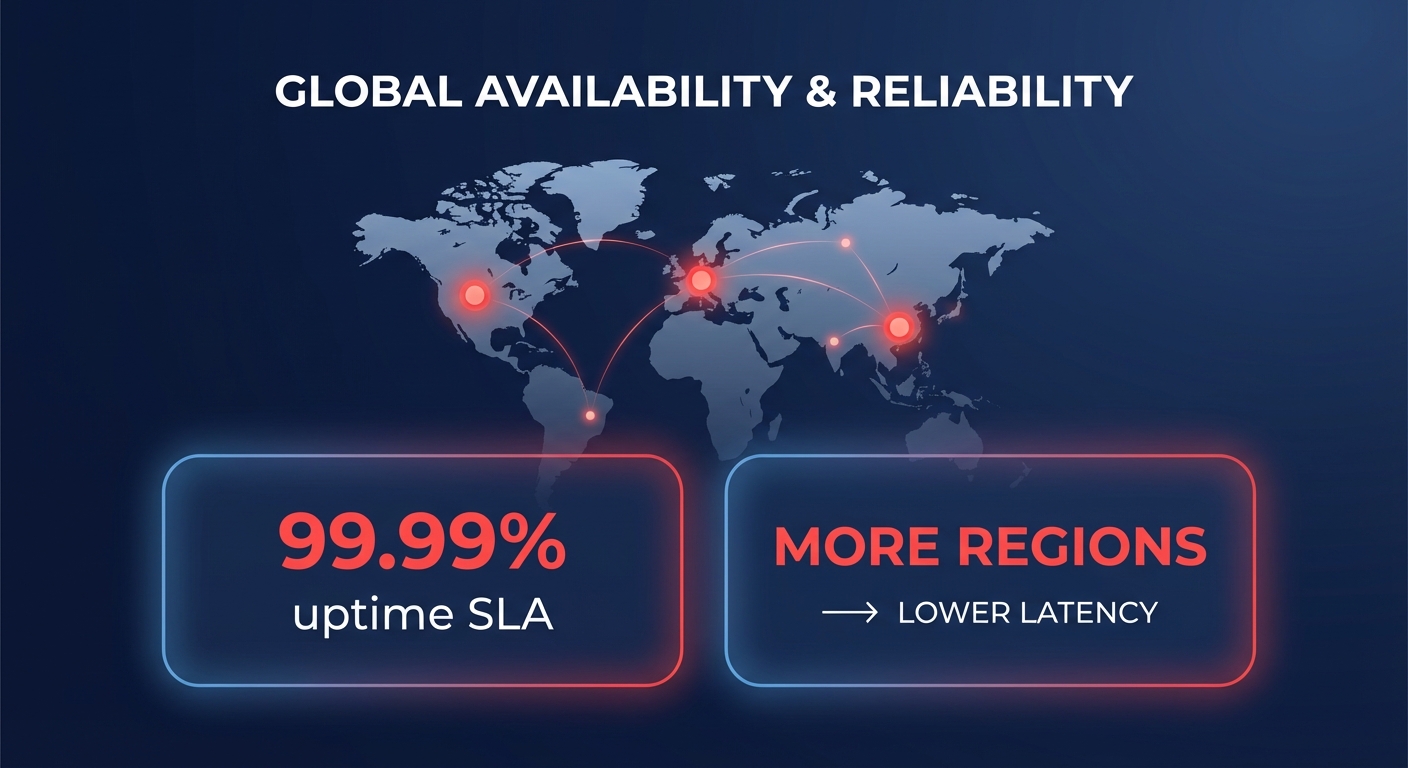
Reliability is the foundation of any cloud strategy, and both providers offer a 99.99% uptime SLA for virtual machines deployed across multiple availability zones. However, the sheer scale of the infrastructure often dictates how well a platform handles the “noisy neighbor” effect. With a 32% market share compared to Azure’s 23%, AWS maintains a significantly larger global footprint. This density of regions and edge locations provides more options for cloud latency reduction techniques, allowing you to place resources physically closer to your end-users to shave off critical milliseconds.
The AWS performance SLA provides a rigorous framework for accountability, offering service credits ranging from 10% to 100% if uptime thresholds are not met. For DevOps teams, this reliability extends to container orchestration. AWS EKS is widely regarded as providing a more robust “vanilla” Kubernetes experience, which often proves easier to scale across multi-cloud environments than the integrated alternatives on Azure. Effective AWS network performance monitoring further ensures that you can distinguish between application-level bottlenecks and underlying infrastructure health.
Scalability and the PaaS advantage
True scalability is defined by how quickly a platform can expand to meet a surge in demand. AWS Aurora, for instance, offers a cloud-native relational database advantage that provides significantly higher throughput and more automated scaling than traditional RDS or Azure SQL instances. This allows your data layer to expand and contract without the manual intervention typically required in legacy environments.
In the serverless realm, AWS Lambda and Azure Functions offer competing visions of event-driven compute. Lambda supports execution limits of up to 15 minutes, offering more headroom than the Azure Functions Consumption plan, which defaults to 5 minutes. While both platforms provide mitigation for “cold starts” – using Provisioned Concurrency on AWS or Premium tiers on Azure – the broader ecosystem of triggers on AWS makes Kubernetes optimization on AWS a more fluid experience. This maturity in the PaaS layer allows you to build complex microservices that scale predictably during peak traffic.
Balancing performance with cost efficiency
The greatest risk to high-performance architecture is the “performance tax” – the tendency for costs to escalate as you chase lower latency. Many teams fall into the trap of over-provisioning to avoid bottlenecks. However, you can often find significant savings through architectural shifts. For instance, comparative cost strategies for cloud providers show that migrating from AWS gp2 to gp3 volumes can reduce storage costs by 20% while maintaining a consistent ,3000 IOPS baseline.
For even more aggressive efficiency, accelerating your Graviton gains can deliver up to 40% better price-performance over comparable x86 instances. While Azure provides its own tools, such as Azure cost anomaly detection, managing these variables manually across a large AWS footprint often drains engineering resources. You must also account for AWS egress costs, which can spike unexpectedly in multi-region deployments if not monitored closely.
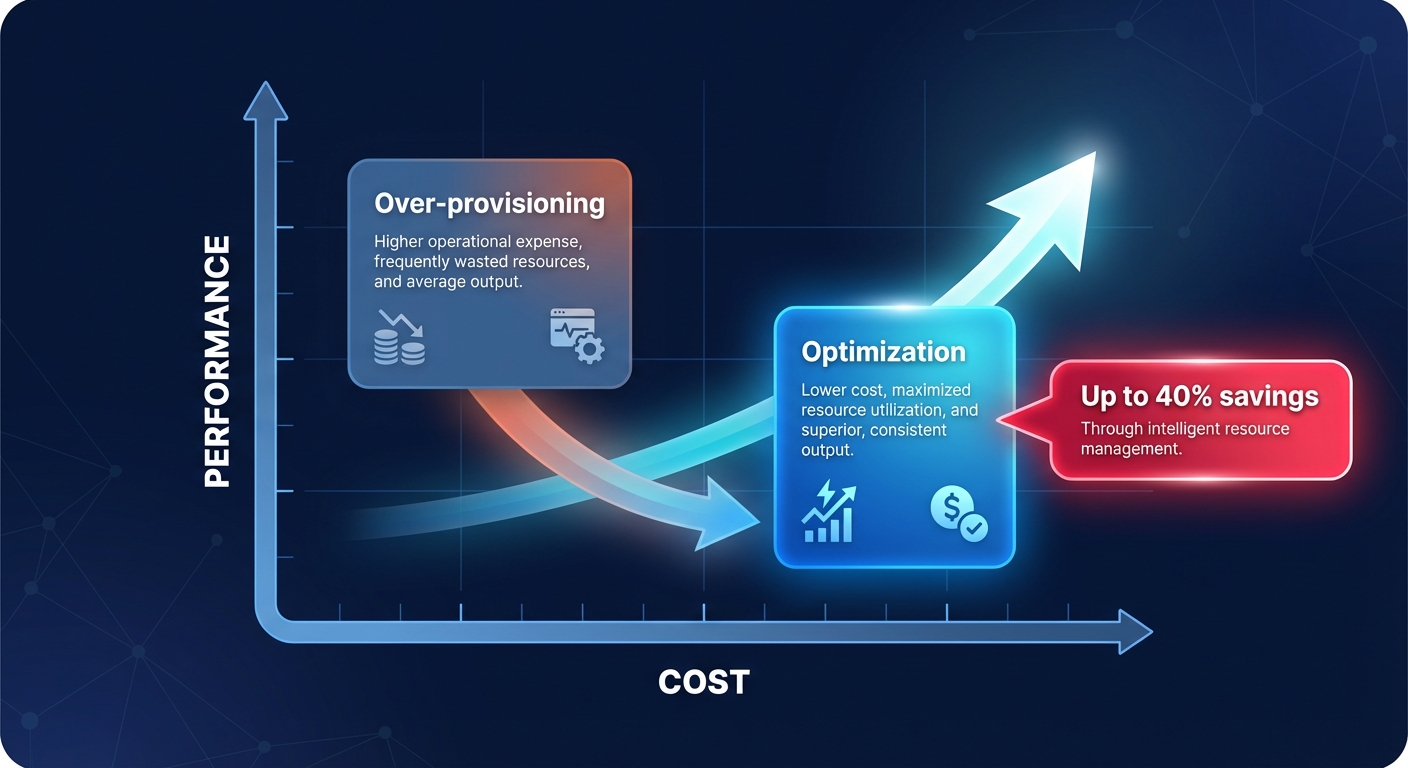
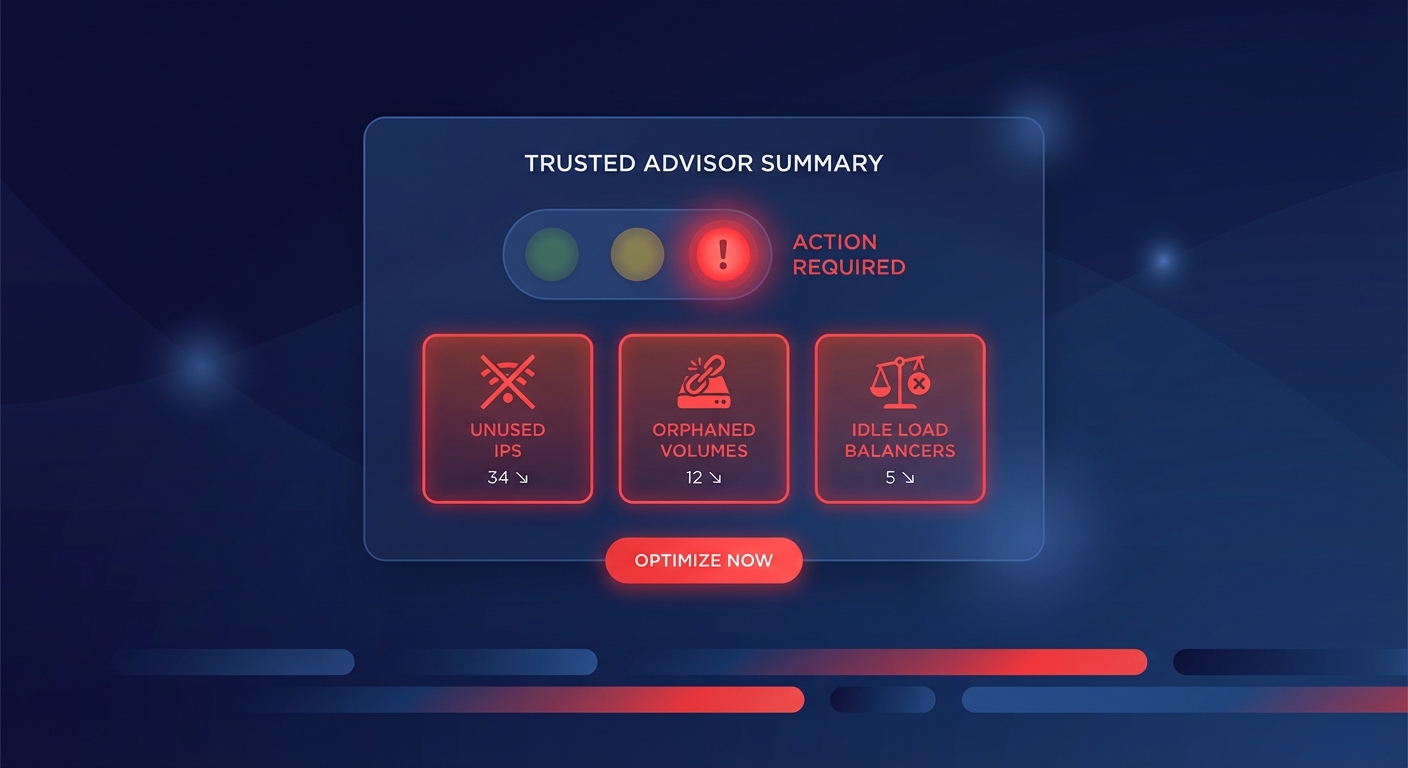
Hykell removes the burden of manual oversight by putting your AWS rate optimization on autopilot. By leveraging AI-driven commitment planning and real-time monitoring, Hykell identifies underutilized resources and applies savings strategies that can reduce your total AWS bill by up to 40% without sacrificing the performance your users expect.
If you are ready to eliminate wasted spend while keeping your infrastructure fast and reliable, Hykell can uncover hidden opportunities through a comprehensive cost audit. You only pay a portion of what you save – if we don’t find savings, you don’t pay anything. View our pricing to see how you can start optimizing your performance-to-cost ratio today.