Are your monitoring tools struggling to keep pace with the ephemeral nature of your Kubernetes clusters? With 96% of enterprises now utilizing Kubernetes, observing short-lived containers has become a critical requirement for platform engineering leaders.
How cloud-native monitoring differs from traditional approaches
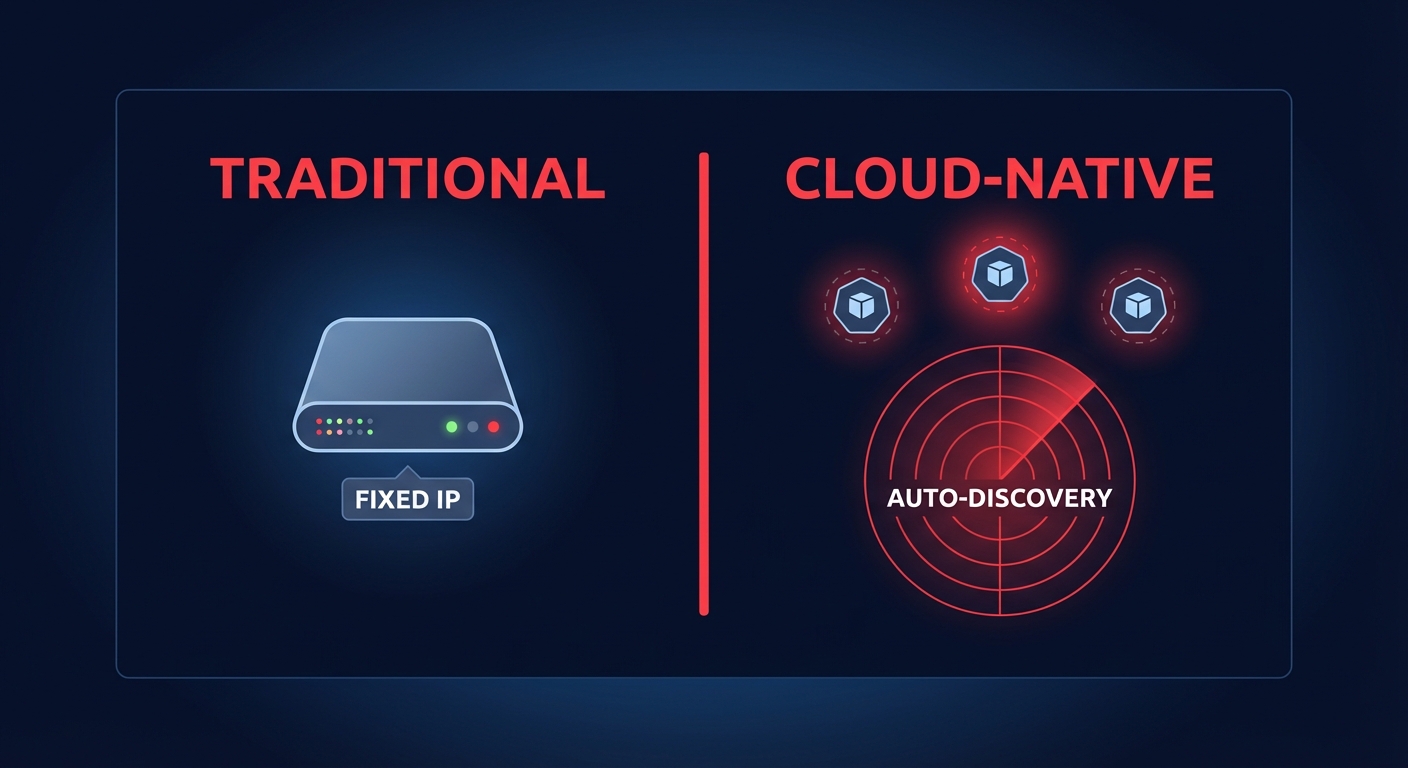
Traditional monitoring was designed for the era of “pets” – static virtual machines with predictable IP addresses and long lifespans. In that world, monitoring the health of the host was usually sufficient. If the server was active and the CPU was not over-saturated, the application was generally considered healthy.
Modern environments running on Amazon EKS or ECS treat infrastructure as “cattle.” Containers are designed to be ephemeral, often living for only minutes or hours. This shift necessitates dynamic discovery, where monitoring tools automatically identify new pods and services as they are spun up by the orchestrator. Furthermore, the high cardinality of containerized data – where metrics are tagged with namespaces, pod IDs, and deployment versions – creates massive datasets that legacy databases struggle to query. In these distributed systems, a single user request might touch dozens of microservices, making it impossible to troubleshoot without tracking the request’s journey across the entire network.
The core pillars of cloud-native observability
To gain a complete picture of your AWS environment, you must move beyond simple “up/down” checks. Modern observability relies on four specific data types that help you understand not just if something is broken, but why.
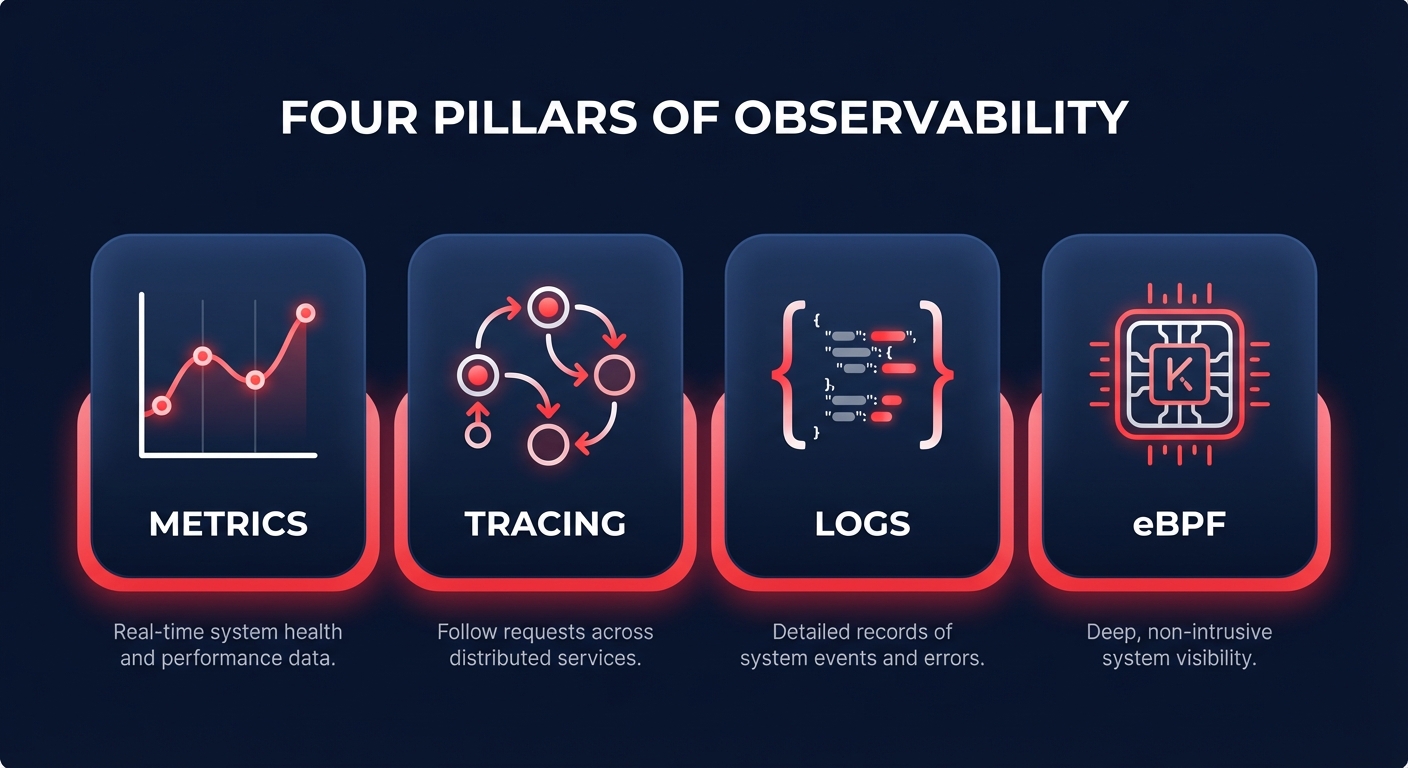
Metrics and time-series data
Metrics provide the numerical representation of your system’s health over time. For Kubernetes leaders, this involves tracking the “Four Golden Signals”: latency, traffic, errors, and saturation. On AWS, this usually starts with AWS CloudWatch application monitoring, which aggregates performance data across your clusters to help you identify trends and baseline performance.
Distributed tracing
As requests move through various microservices, distributed tracing allows you to follow the “thread” of an execution. Tools like AWS X-Ray or OpenTelemetry provide service maps that visualize dependencies and identify exactly which service is causing a bottleneck in a complex transaction.
Structured logging
Logs provide the narrative of your application’s behavior. In a cloud-native context, logs must be structured, typically in JSON format, to ensure they are searchable across thousands of containers. However, managing AWS CloudWatch logs pricing is a persistent challenge; the sheer volume of data produced by containers can lead to significant cost spikes if retention policies and ingestion rates are not actively optimized.
eBPF and deep kernel insights
The latest frontier in monitoring is eBPF (Extended Berkeley Packet Filter). This technology allows you to run sandboxed programs in the Linux kernel without changing your application code. It provides deep visibility into AWS network performance monitoring and security without the performance overhead associated with traditional sidecar agents.
Key capabilities for engineering leaders
Beyond selecting the right data types, engineering leaders must focus on capabilities that actively reduce operational toil. Effective strategies begin with tag-based attribution, where every metric and log is categorized by team and project to provide a clear foundation for Kubernetes cost monitoring. In elastic environments where standard thresholds often trigger false positives, ML-driven anomaly detection is essential for identifying a genuine cost or performance anomaly without overwhelming your SRE teams. Finally, automated service maps are vital for reducing troubleshooting time, as they allow engineers to visualize how service-to-service dependencies influence overall application health.
Why observability is the secret to cost optimization
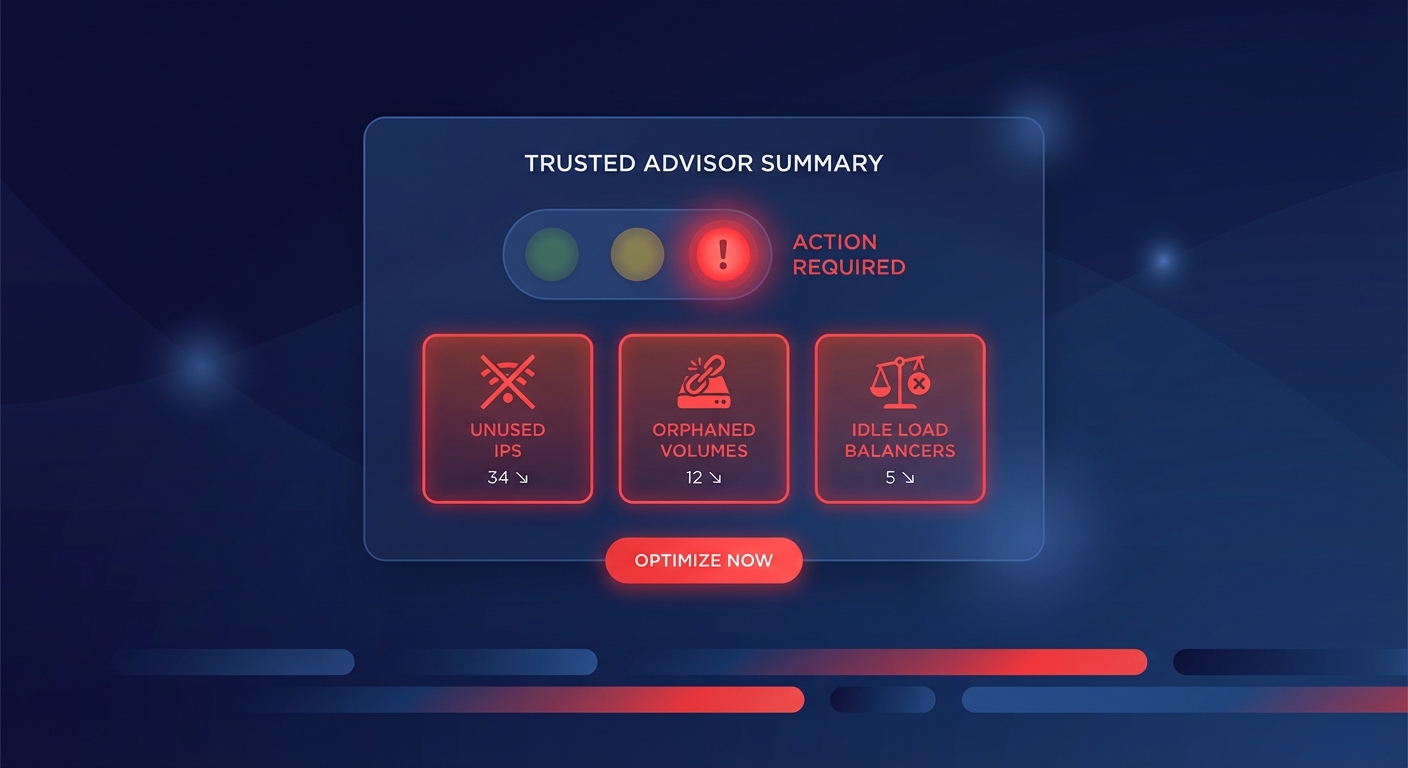
There is a direct, measurable link between how well you monitor your applications and how much you pay for your AWS bill. Industry research shows that most Kubernetes workloads actually use less than 25% of their requested CPU capacity. Without granular monitoring, engineers frequently “pad” their resource requests to avoid performance issues, leading to massive cloud waste.
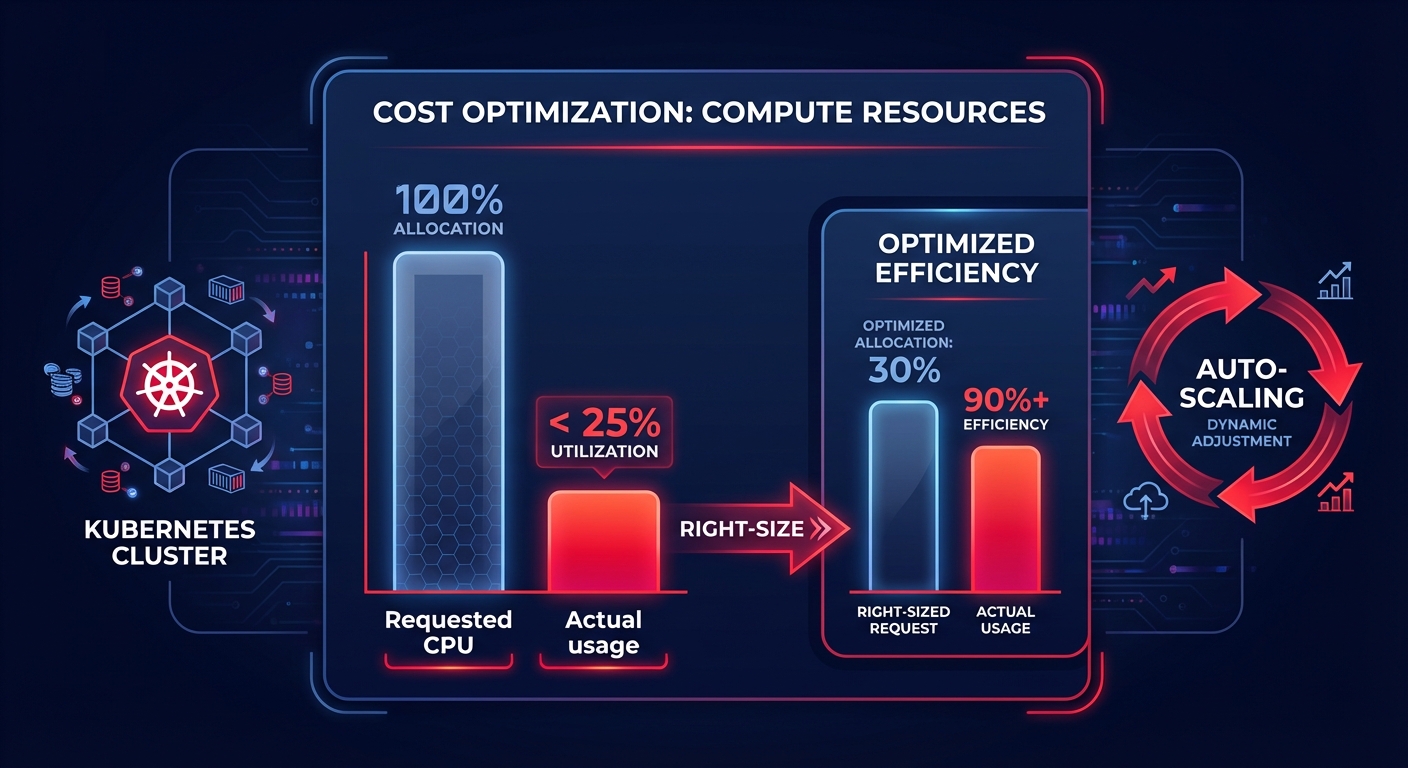
Effective Kubernetes optimization on AWS requires using monitoring data to right-size pods and nodes dynamically. For example, by integrating performance metrics with tools like Karpenter for scaling, you can ensure that your infrastructure shrinks and grows in lockstep with actual user demand, eliminating the cost of idle resources.
Best practices for an AWS-based stack
Success in an AWS-based environment requires a commitment to standardization and outcome-based alerting. Teams should aim to standardize on the AWS Distro for OpenTelemetry (ADOT) to avoid vendor lock-in, which facilitates easier data migration when comparing monitoring tools like Datadog and Grafana. Rather than alerting on every minor metric fluctuation, the focus should shift toward Service Level Objectives (SLOs) that reflect actual business impact, such as user-facing availability or checkout success rates. To achieve peak efficiency, mature organizations close the loop by using monitoring data to trigger automated infrastructure changes, such as applying cloud latency reduction techniques or migrating EBS volumes to more cost-effective tiers.
True cloud-native observability is about creating a transparent environment where performance and cost are treated as two sides of the same coin. By moving from reactive troubleshooting to proactive monitoring, you can reclaim engineering hours and significantly reduce infrastructure overhead. If you are ready to see how your monitoring data can be turned into immediate savings, explore how Hykell’s observability platform provides the clarity needed to optimize your AWS environment on autopilot. You can also reach out for a detailed cost audit to uncover the hidden efficiencies in your Kubernetes clusters.