Are your Amazon RDS for MySQL instances struggling to keep up with production traffic while cloud costs climb? Achieving peak performance does not always require a larger instance; it requires a surgical approach to configuration, storage, and automated resource management.
Selecting the right compute and storage architecture
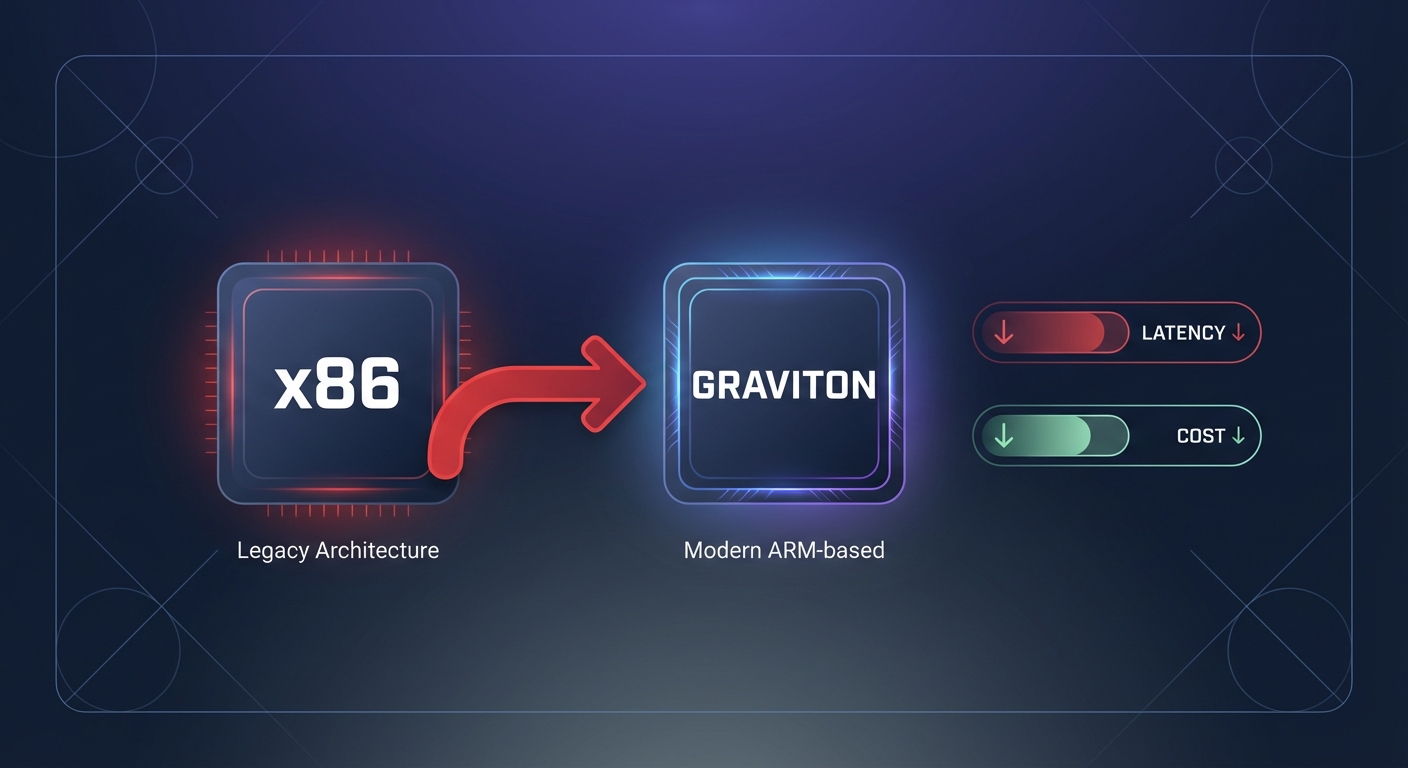
Performance tuning begins at the infrastructure layer, as your choice of instance and storage defines the physical boundaries of your database capacity. While many teams default to the largest x86 instances, migrating to AWS Graviton instances can offer up to 40% better price-performance for MySQL workloads. Moving to the db.r7g or db.m7g families allows you to handle more concurrent connections with lower latency while simultaneously reducing your compute spend.
Storage selection is equally critical for I/O-intensive workloads. Migrating from gp2 to gp3 is an essential step because it allows you to decouple performance from capacity. While gp2 ties your IOPS to the volume size, optimizing AWS EBS performance through gp3 lets you scale IOPS and throughput independently, often resulting in a 20% cost reduction. For environments with heavy write demands, Amazon RDS Optimized Writes can achieve up to 2x higher write transaction throughput by writing once to durable storage without the doublewrite buffer. This feature is supported on RDS for MySQL version 8.0.30 and higher for databases created after November 27, 2022.
Database configuration and parameter tuning
The default RDS parameter groups provide a stable baseline, but they are rarely optimized for heavy production workloads. Your primary goal is to ensure your “working set” – the data frequently accessed by your application – resides entirely in memory to avoid the high latency of disk reads.
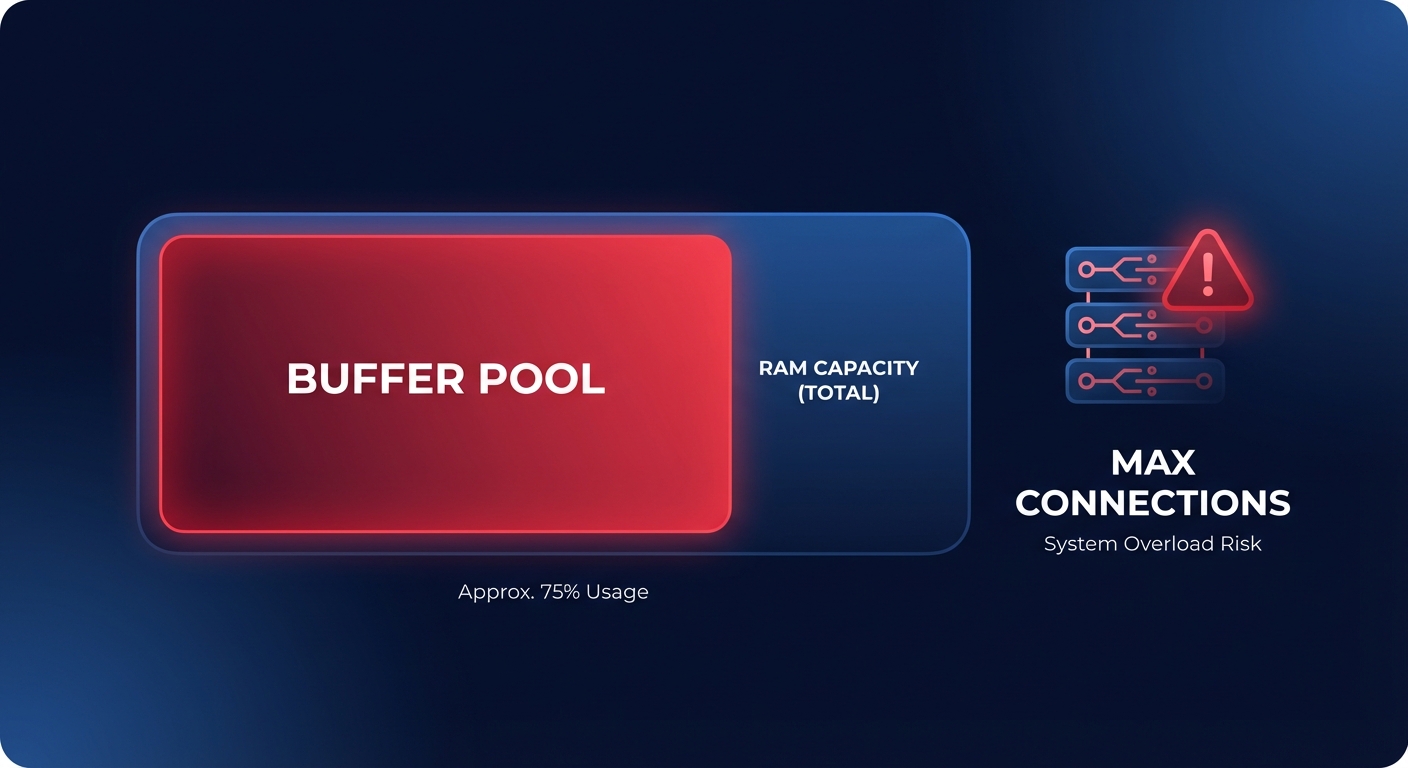
- innodbbufferpool_size: This is the most critical parameter for MySQL performance. It should be large enough to cache your data and indexes. On Amazon RDS, this is typically set to 75% of the instance’s total RAM to maximize memory efficiency.
- max_connections: Each connection consumes memory, and setting this value too high can lead to memory pressure. If the instance runs out of RAM, it may experience disk thrashing, which forces the database to spend more time moving data between RAM and storage than executing queries.
- Table management: A high number of tables in the InnoDB storage engine can contribute to performance degradation regardless of table size. It is a best practice for Amazon RDS to keep the MySQL table file size under 16 TiB and use partitioning for large datasets to improve query plan efficiency and crash recovery speed.
Query and index optimization
Even the most powerful hardware cannot save a database from unoptimized queries. You can use insights from Amazon Aurora performance tuning methodologies to identify “Top SQL” by wait events. If you observe high I/O waits, it often indicates missing indexes or full table scans that are forcing the engine to read from the disk.
When building indexes, focus on the clauses frequently used in your application, such as WHERE, JOIN, and ORDER BY. You must balance this by avoiding over-indexing, as every new index adds overhead to write operations like INSERT and UPDATE. For read-heavy applications, scaling AWS RDS read replica performance can offload traffic from the primary instance. However, you must monitor replication lag closely to ensure that the data being served to users remains consistent with the primary node.
Monitoring for bottlenecks
Effective tuning requires real-time visibility into how your database interacts with the underlying infrastructure. You should establish AWS CloudWatch application monitoring for several key metrics to detect bottlenecks before they impact your users.
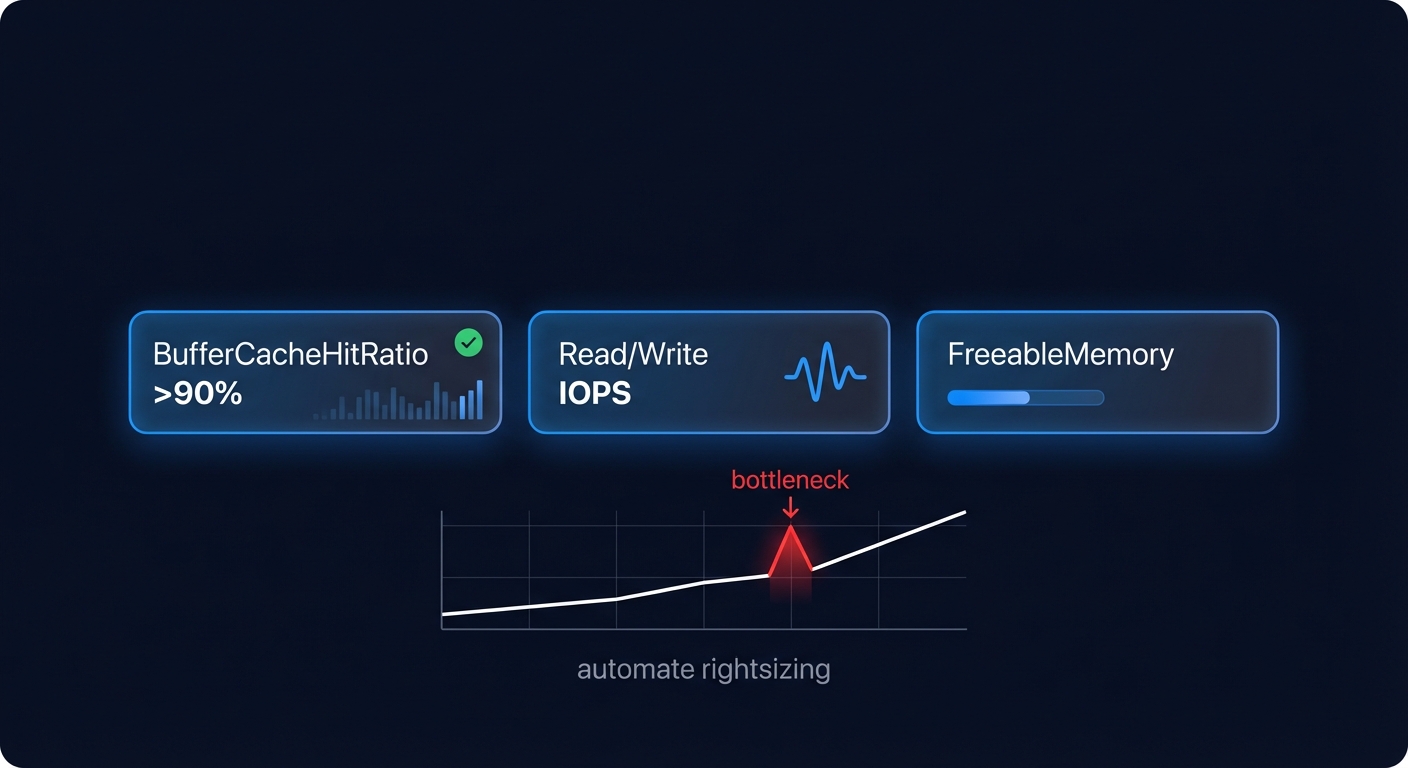
- BufferCacheHitRatio: This should ideally remain above 90%. A drop in this ratio indicates that the database is reading from disk too frequently, suggesting you may need to increase memory or optimize queries.
- ReadIOPS and WriteIOPS: Compare these against your provisioned limits to ensure you are not hitting EBS throughput limits. If you consistently hit 100% of your capacity, queries will queue and application latency will spike.
- FreeableMemory: If this value approaches zero, your instance is at risk of Out-of-Memory (OOM) kills. This is often a signal that your max_connections or buffer pool settings are too aggressive for your instance size.
Automating performance and cost optimization
The challenge for most DevOps teams is not just knowing how to tune a database, but finding the time to do it continuously as traffic patterns change. Manually rightsizing instances or managing AWS rate optimization is a complex task that often falls to the bottom of the priority list, leading to wasted spend and performance degradation.
Hykell solves this by putting your AWS RDS cost optimization automation on autopilot. The platform analyzes your actual performance metrics, such as p95 CPU and freeable memory, to identify rightsizing opportunities that do not compromise your SLAs. Hykell can also help you accelerate your Graviton gains by managing the transition to ARM-based instances and automatically balancing your commitment-based discounts, such as Reserved Instances and Savings Plans.
By combining deep technical tuning with Hykell’s automated efficiency, companies typically reduce their AWS spend by up to 40% while maintaining the high-performance database infrastructure their applications require. You can use the Hykell cost savings calculator or book a free cost audit to uncover hidden efficiencies in your RDS environment today.