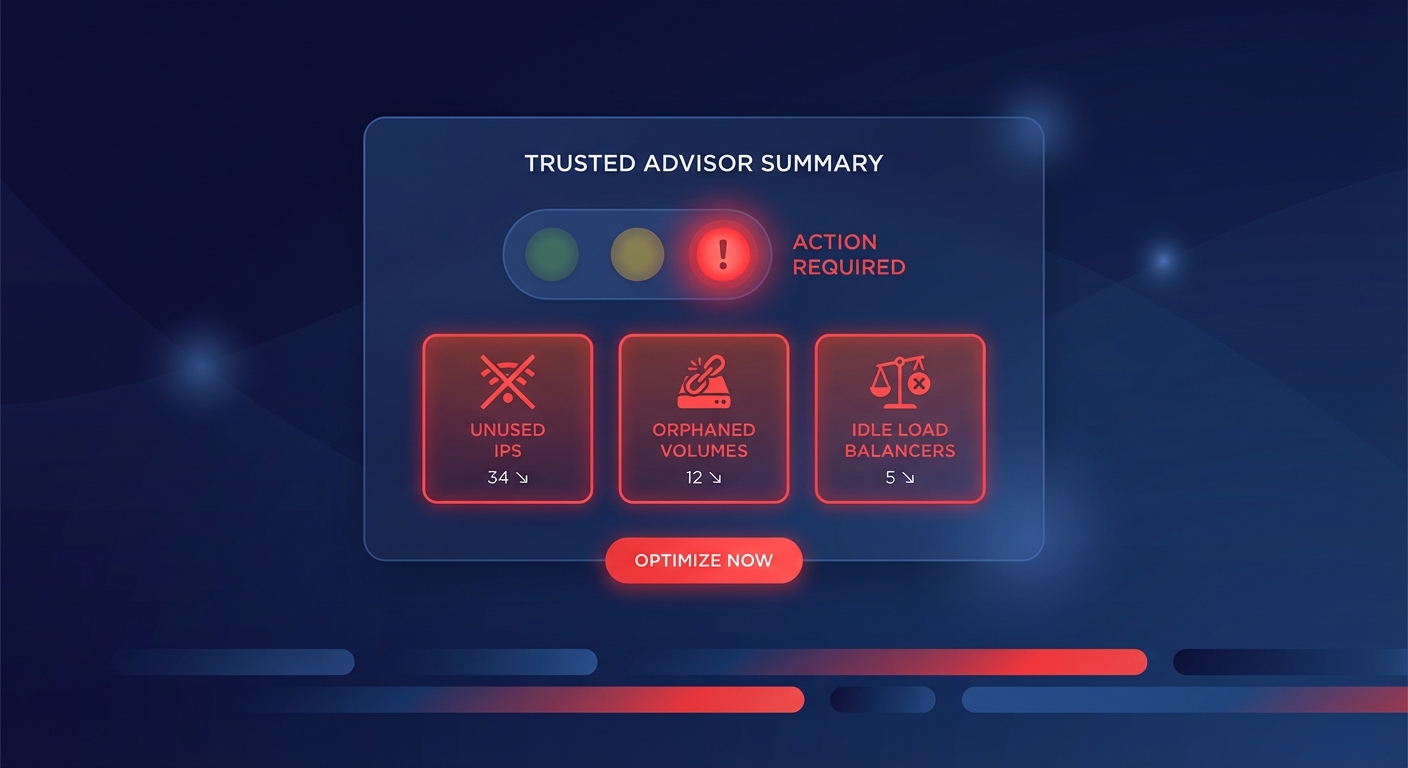
Did you know that for many high-growth engineering teams, the cost of monitoring can represent up to 30% of their monthly AWS bill? Effective observability isn’t just about finding bugs; it’s about balancing application reliability with cloud financial health.
When you run distributed applications on AWS, you need more than just a dashboard. You need a strategy that correlates performance signals with resource efficiency. This guide breaks down how to build an end-to-end monitoring pipeline using Amazon CloudWatch and how to leverage that data to drive automated cloud cost optimization.
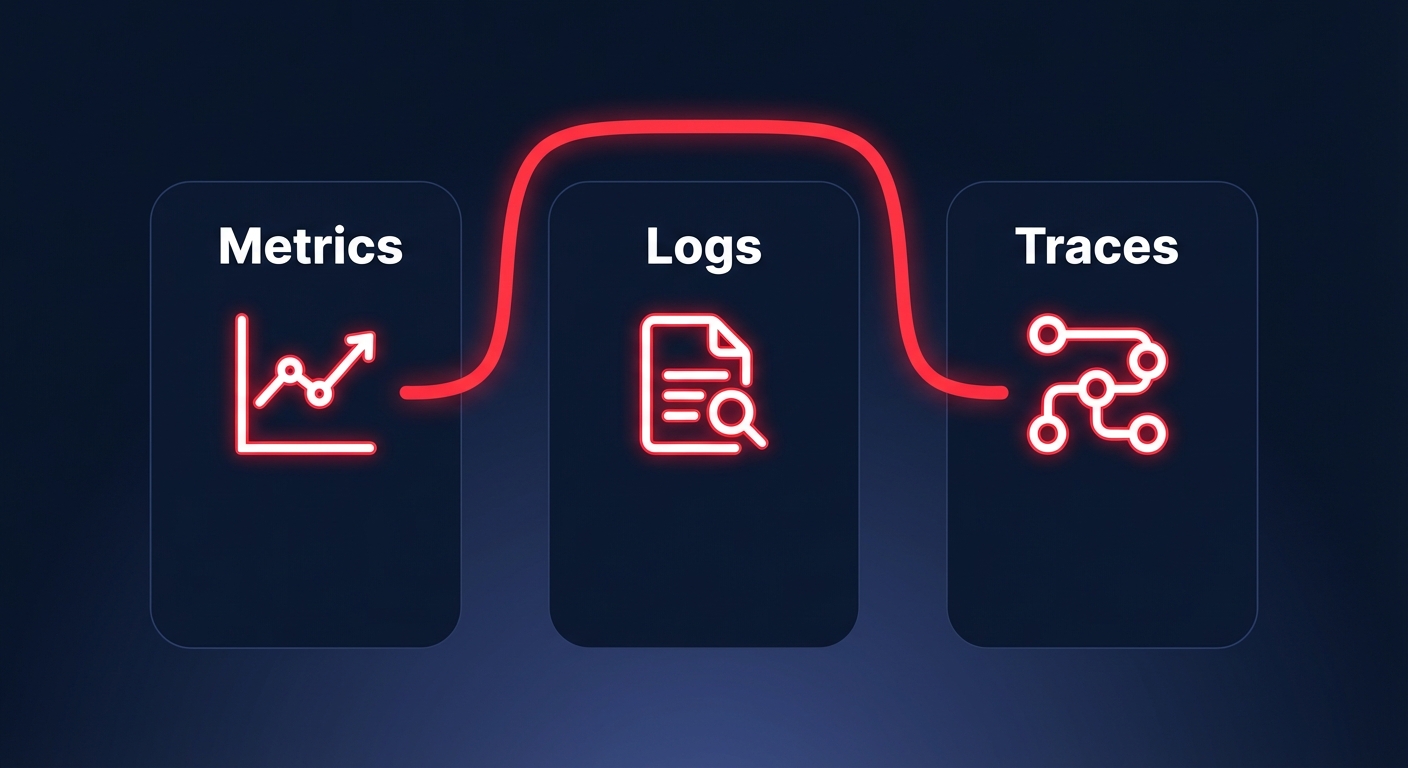
The three pillars of AWS observability
To maintain high availability, your monitoring strategy must cover three distinct data types: metrics, logs, and traces. Relying on just one creates visibility gaps that increase your Mean Time to Resolution (MTTR) and lead to over-provisioned infrastructure.
Metrics: The vital signs
Metrics are numerical data points that represent the health of your system over time. In AWS, cloud-native application monitoring typically focuses on the “Four Golden Signals”: latency, traffic, errors, and saturation. While CloudWatch provides basic metrics for services like EC2 and RDS at five-minute intervals, you should enable detailed monitoring for production workloads to get one-minute granularity. This precision is essential for triggering real-time cloud performance analytics and auto-scaling events that prevent downtime during traffic spikes.
Logs: The diagnostic narrative
Logs provide the deep context that numerical metrics often lack. However, Amazon CloudWatch logs pricing can quickly become a “zombie cost” if not proactively managed. With ingestion rates at $0.50 per GB in most regions, verbose logging in production is a common financial trap. You should use CloudWatch Logs Insights to query historical data and set aggressive retention policies to move older logs to S3 Glacier, preventing your observability bill from spiraling out of control.
Traces: The request journey
For microservices, AWS X-Ray is an indispensable tool for understanding the request journey. It provides a service map that visualizes how requests move through your architecture, helping you isolate whether a bottleneck lives in your API Gateway, a Lambda function, or a downstream RDS database. By correlating these traces with AWS application performance monitoring tools, you can see exactly how a slow database query impacts the end-user experience and conversion rates.
Setting up an end-to-end monitoring pipeline
Building a robust pipeline requires moving from reactive alerts to proactive insights. A best-practice setup involves a centralized hub-and-spoke model, especially for multi-account architectures, to aggregate data into a single monitoring account. This prevents DevOps teams from having to context-switch between dozens of accounts during an active incident.
To gain full visibility, you should install the CloudWatch agent on your EC2 instances to capture system-level metrics like memory utilization and disk I/O, which are not available through standard hypervisor monitoring. Beyond infrastructure, you can use CloudWatch Synthetics to run canary scripts that mimic user behavior. This allows you to catch issues – such as a broken checkout button or a failing login form – before your customers do.
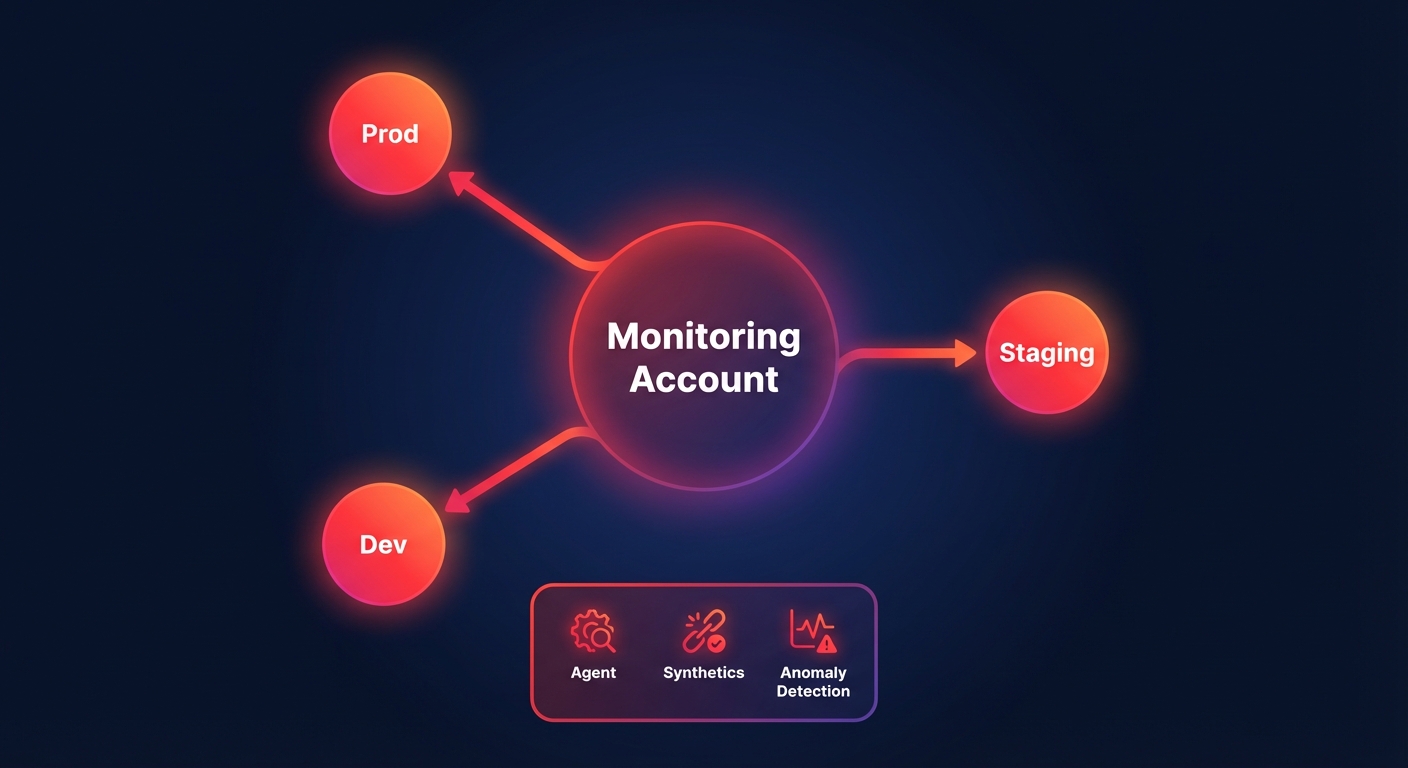
Finally, you should enable CloudWatch Anomaly Detection to move away from static thresholds that cause alert fatigue. This feature uses machine learning to identify unusual patterns based on historical trends, such as a sudden spike in latency that bypasses traditional alerts but indicates a failing cloud latency reduction techniques implementation.
Using monitoring data to improve reliability and cost
Data is only valuable if it leads to meaningful action. Engineering leaders should use CloudWatch data to feed two primary workstreams: performance engineering and FinOps. For performance, you must monitor your AWS performance SLA targets. If your 95th percentile latency is creeping up, use CloudWatch Contributor Insights to find the “Top N” contributors – such as a specific user ID or resource – that are causing the degradation.
From a cost perspective, monitoring data is your best weapon against waste. Many teams use AWS Cost Explorer vs AWS Budgets to track high-level spend, but CloudWatch metrics reveal the actual reasons behind the bill. For example, if your metrics show that an EC2 fleet rarely exceeds 10% CPU utilization, you have identified a prime candidate for right-sizing. Similarly, monitoring AWS network performance monitoring data can reveal expensive cross-AZ data transfer patterns that can be optimized by adjusting your service placement.
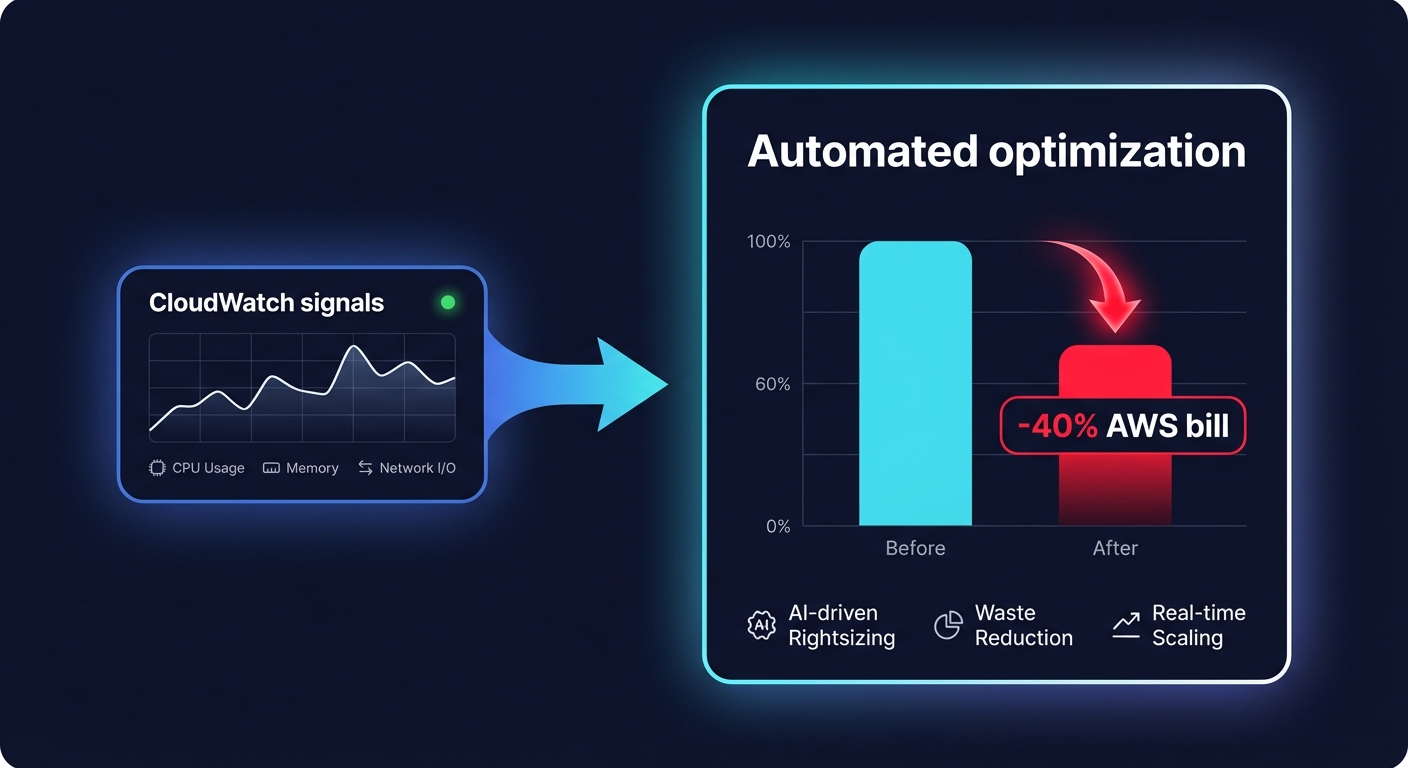
From manual dashboards to automated optimization
While CloudWatch is excellent for visibility, it does not automatically fix your infrastructure’s cost inefficiencies. Engineering teams often find themselves in a cycle of manual firefighting – identifying a waste pattern in a dashboard but lacking the time to implement the fix across hundreds of resources. This is where Hykell transforms your cloud operations.
While you use CloudWatch to monitor application health, Hykell provides automated cloud cost management that acts on that data in real-time. We do not just show you where you are overspending; we optimize your environment on autopilot. Hykell’s cloud observability platform integrates with your AWS environment to identify underutilized resources, optimize EBS and EC2 configurations, and manage AWS rate optimization strategies without any engineering lift from your side.
Our customers typically see a 40% reduction in their AWS bill by allowing our AI-driven tools to handle the complexities of commitment rebalancing and resource right-sizing. Hykell operates on a performance-based model: we only take a slice of what we save you. If you don’t save, you don’t pay.
Book a free cost audit with Hykell today and see how much of your AWS spend you could be putting back into your R&D budget.