Is your AWS infrastructure a black box where performance spikes and bill shocks hide? For engineering leaders, visibility ensures that every millisecond of performance doesn’t unnecessarily erode your margins. Let’s look at how to bridge the gap between application health and cost efficiency.
Beyond the dashboard: why APM matters on AWS
Application Performance Monitoring (APM) has evolved from simple checks into a sophisticated discipline of distributed observability. In an AWS environment, where ephemeral containers and serverless functions are the norm, traditional monitoring fails because it cannot trace requests across a constantly shifting architecture.
Effective APM allows you to distinguish between application-level bugs and underlying infrastructure constraints. When a user experiences high latency, you must determine if it is a poorly optimized database query or if the EC2 instance is hitting its network throughput limit. Without the right tools, your team spends hours on “performance forensics” instead of building new features.
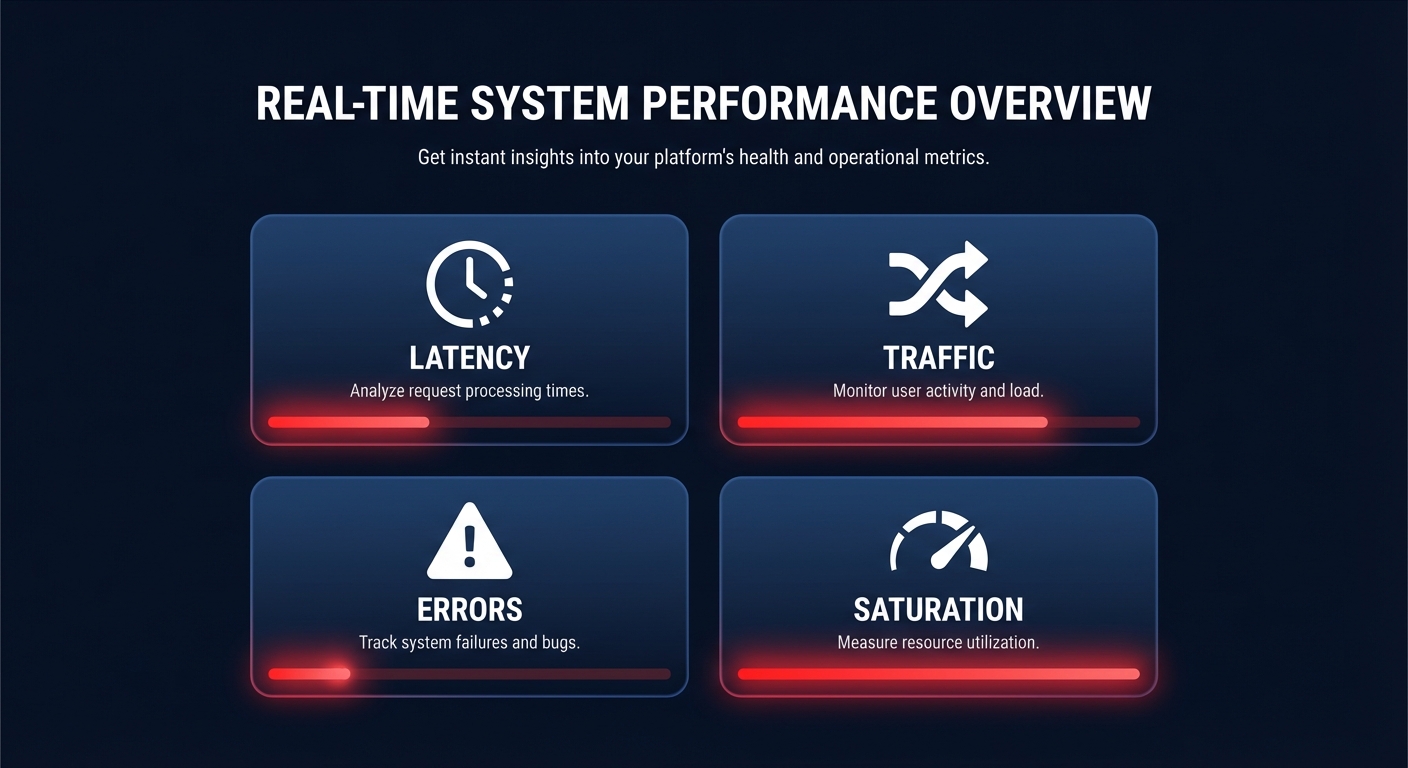
The four golden signals of cloud performance
To maintain a healthy AWS performance SLA, engineering teams generally focus on four critical metrics: latency, traffic, errors, and saturation. These signals provide a high-level view of system health and user experience.
Latency measures the time it takes to service a request. It is vital to track percentiles rather than simple averages to understand the true user experience. For example, while a P50 of 100ms looks acceptable, a P99 of 2 seconds means that 1% of your users – often those generating the most transactions – are facing significant delays.
Traffic tracks the demand placed on your system, typically measured in requests per second or transactions per minute. Understanding the relationship between throughput and response time is essential, as throughput often decreases when a system reaches its capacity limits.
Errors represent the rate of failed requests. This includes explicit failures like 500-series status codes, implicit errors where the wrong data is returned, or policy-based failures such as timeouts. Tracking these helps calculate your Apdex score, where a score of 0.85, for instance, indicates that 85% of your users are satisfied with the current performance.
Saturation measures how “full” your service is. This includes resource utilization metrics like CPU, memory, and I/O. As systems approach total capacity, response times typically increase exponentially, making this a lead indicator for potential outages.
Navigating the AWS-native monitoring stack
AWS provides a robust suite of tools designed to provide cloud-native application monitoring without requiring complex third-party agents. These tools integrate directly with the AWS control plane to provide immediate visibility.
Amazon CloudWatch as the observability backbone
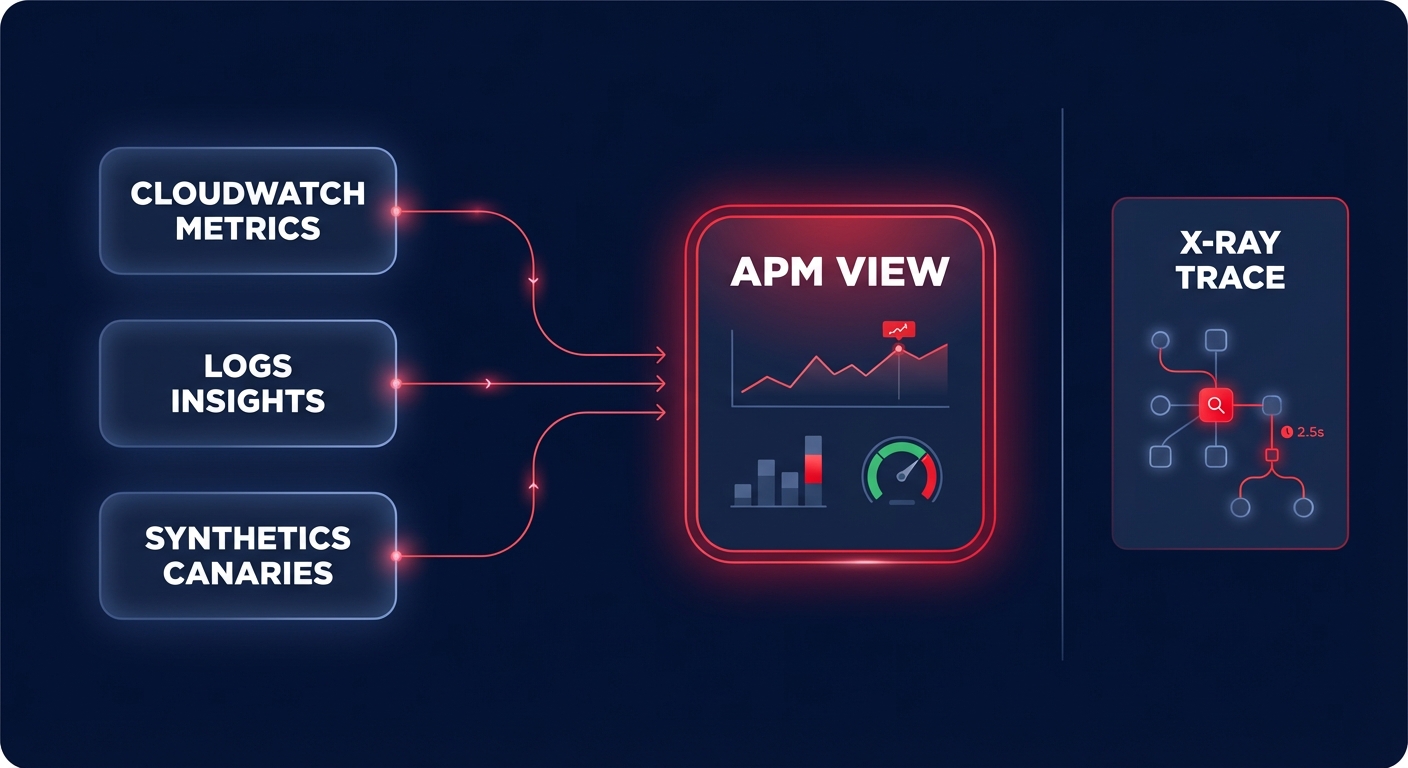
Amazon CloudWatch is the foundational monitoring service for AWS. It collects and tracks metrics, sets alarms, and allows you to react automatically to changes in your resources. You can track standard metrics for EC2, but you can also ingest application-level data via the CloudWatch Agent to monitor memory utilization or cache hit rates.
CloudWatch Logs Insights allows you to run interactive queries on log data to identify the root cause of failures in seconds. Additionally, you can use Synthetics to create “canaries” that simulate user journeys 24/7. These canaries alert you if a critical path – such as a login or checkout button – stops working, even if your underlying infrastructure metrics appear green.
AWS X-Ray for distributed tracing
In a microservices architecture, a single user request might pass through an API Gateway, multiple Lambda functions, and an RDS database. AWS X-Ray provides distributed tracing, creating a service map that visualizes these dependencies. This helps developers pinpoint exactly where bottlenecks occur and identifies which specific service is responsible for a spike in the error rate.
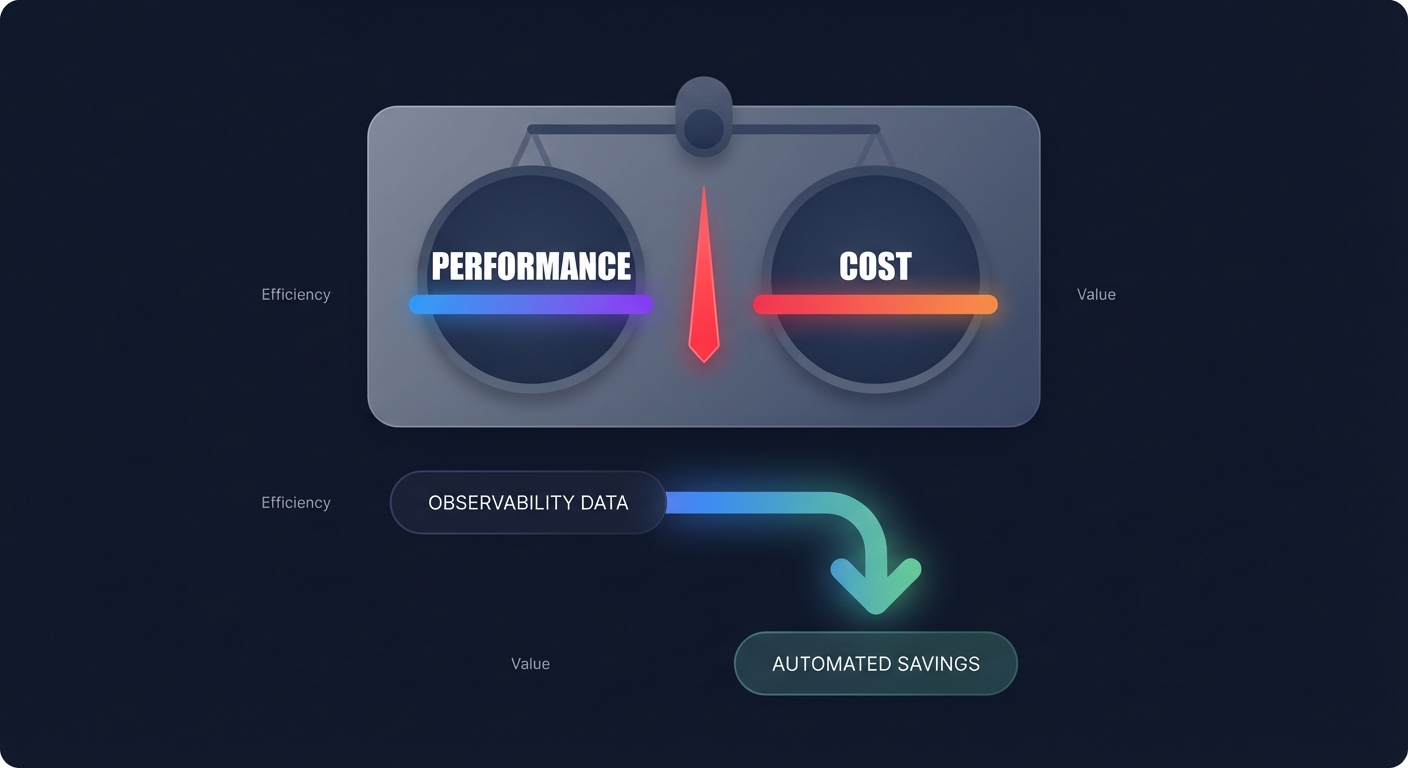
The hidden link: correlating performance with FinOps
Performance and cost are two sides of the same coin in the cloud. Most engineering leaders face a constant balance of cost-performance tradeoffs. If you over-provision to ensure zero latency, your AWS bill balloons; if you under-provision to save money, your user experience suffers.
The cost of over-provisioning
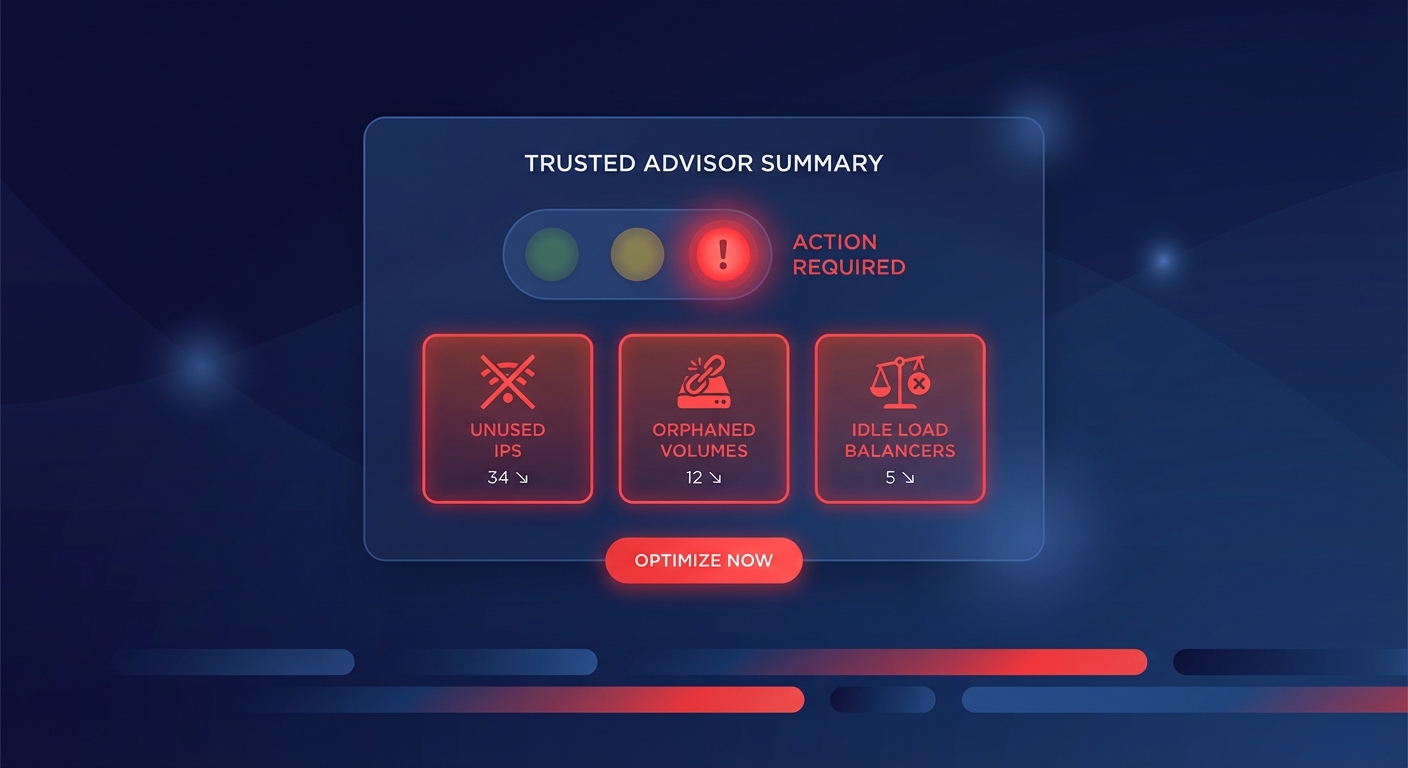
Research indicates that a typical enterprise AWS environment has up to 35% of its resources underutilized. APM data is the most reliable tool for cloud resource rightsizing. For example, if CloudWatch shows an EC2 instance family consistently running at less than 20% CPU utilization over a 30-day period, it is a prime candidate for downsizing or moving to a more efficient instance family like Graviton.
Controlling observability spend
A common pitfall for high-growth teams is the “observability bill spiral.” Detailed monitoring generates massive amounts of data, and CloudWatch Logs pricing can eventually account for up to 30% of a monthly AWS bill if ingestion and retention policies aren’t managed.
To prevent this, you should set aggressive retention policies for non-production logs and utilize metric filters to turn log data into cheaper CloudWatch metrics. By managing these policies, you ensure that your visibility does not become a primary driver of cloud waste.
Turning performance data into automated savings
Monitoring is only valuable if it leads to action. For many organizations, the gap between seeing an inefficiency and fixing it involves weeks of engineering effort. This is where Hykell bridges the gap by turning observability into automated execution.
Hykell uses your existing performance and usage data to identify precisely where you are overpaying for your AWS infrastructure. Instead of just providing a dashboard of problems, Hykell delivers AWS rate optimization and automated adjustments that reduce costs by up to 40%. These optimizations happen without requiring your developers to change code or manage ongoing manual tasks.
By linking real-time data with automated execution, you ensure that your applications perform at their peak while your AWS bill remains lean. Hykell operates on a pay-for-results model: if the platform does not find savings for you, you do not pay.
Ready to see how much your performance data could be saving you? Use our cost savings calculator or book a free audit to see your potential reduction on autopilot.