Are you chasing “disk ghosts” while your database performance craters and application timeouts spike? High Amazon EBS latency often stems from EC2 configuration rather than the physical disk itself, making diagnosis a frustrating puzzle for SRE and DevOps teams.
How Amazon EBS latency works in practice
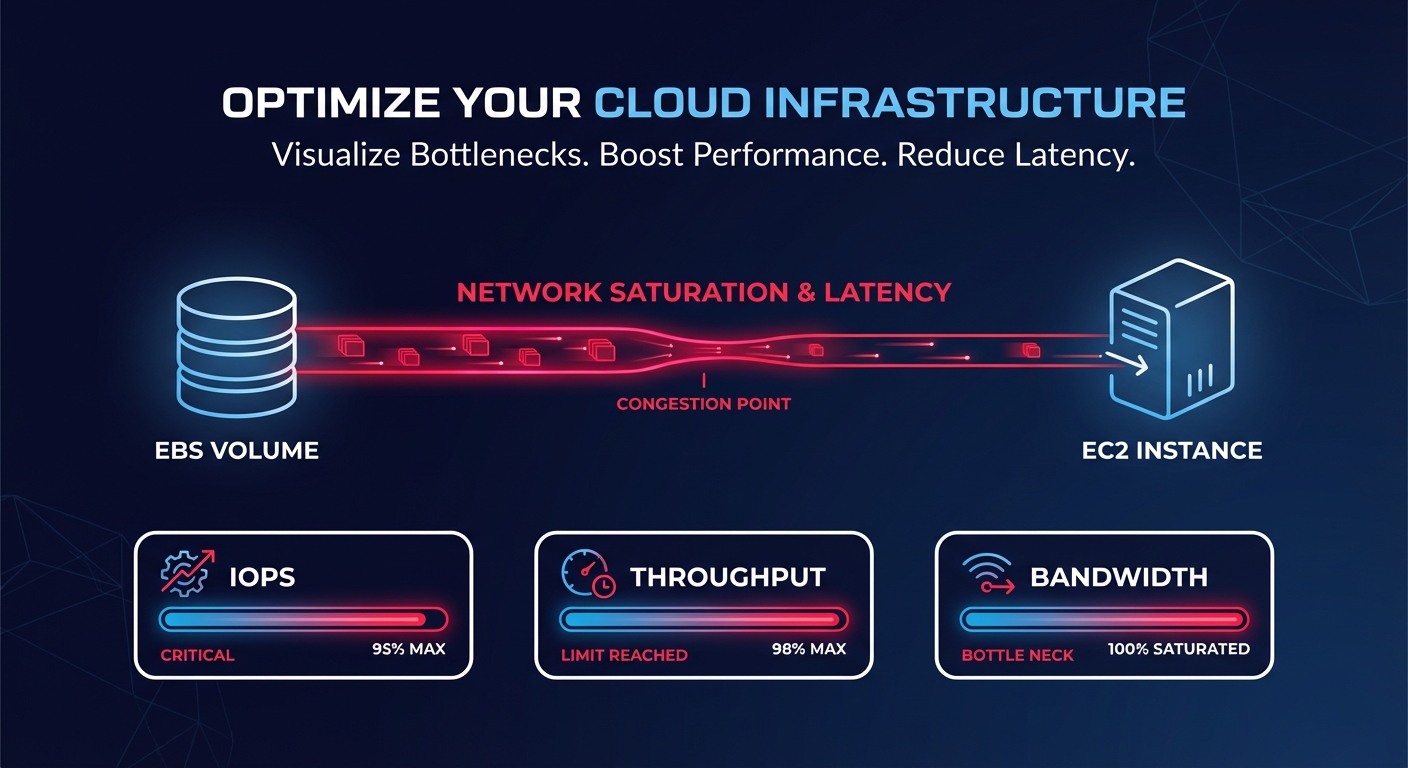
Latency is the time it takes for a single I/O operation to complete. In the context of Amazon Elastic Block Store (EBS), this measurement reflects the network-attached nature of the storage. Because EBS volumes are not physically inside your EC2 instance, every read or write must travel across the AWS internal network. Understanding the nuances of this architecture is the first step toward achieving cloud latency reduction without overspending on provisioned IOPS.
Amazon EBS performance is governed by a “bucket” of resources including IOPS, throughput, and the available bandwidth of the EC2 instance it is attached to. When your application issues a read request, the data travels from the EBS backend through a dedicated network path to the EC2 instance. If any part of this path is saturated, latency increases. For example, gp3 volumes are designed to provide single-digit millisecond latency for the majority of workloads. However, at low thread counts, gp3 can exhibit higher latency variation compared to io2 volumes, which are engineered for sub-millisecond consistency. For mission-critical databases like RDS MySQL or PostgreSQL, even a jump from 1ms to 5ms can lead to connection queuing and application bottlenecks.
Measuring and interpreting EBS latency metrics
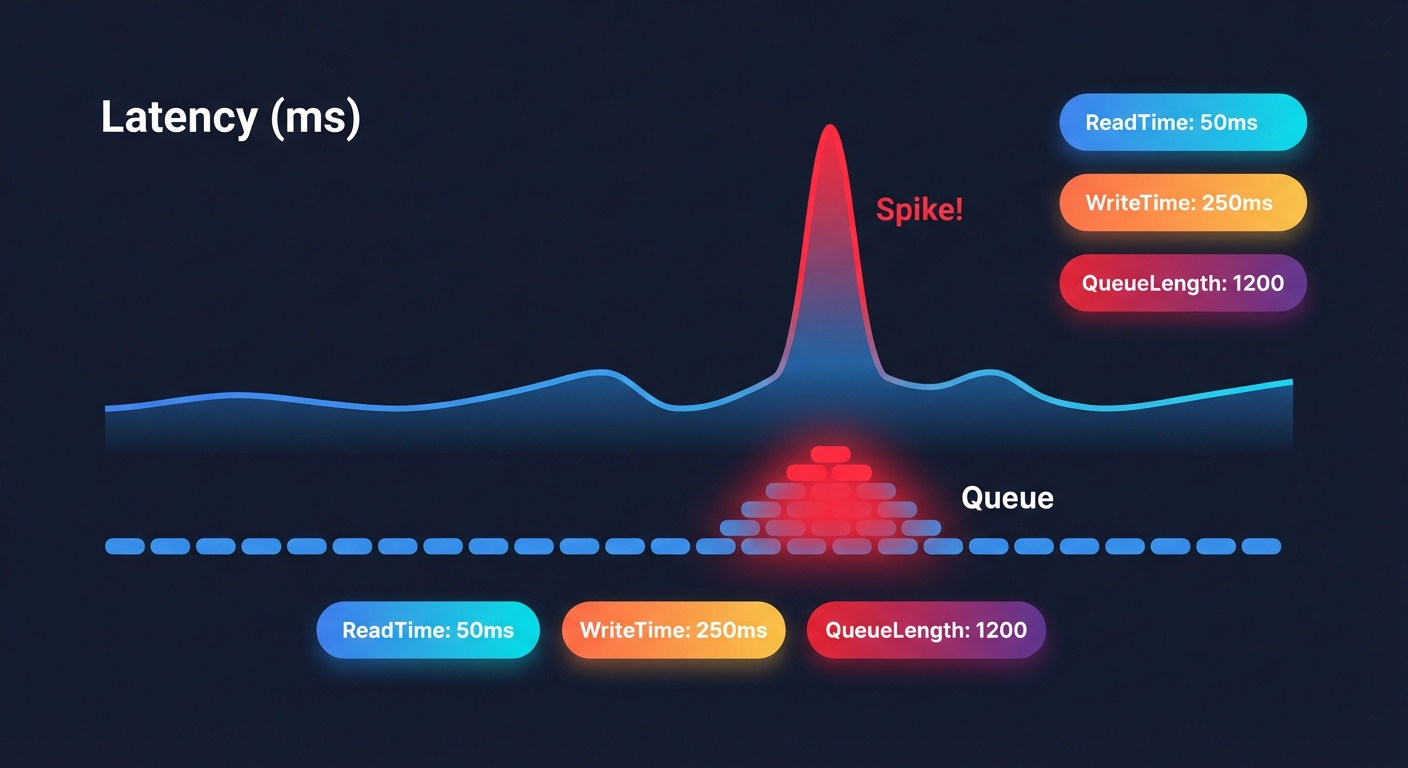
To accurately diagnose latency, you cannot rely on simple “disk busy” percentages. You must dive into Amazon CloudWatch metrics to see what is happening at the volume level. Effective CloudWatch monitoring requires looking at VolumeTotalReadTime and VolumeTotalWriteTime, which measure the total number of seconds spent on all I/O operations. To find the average latency per operation, you should divide the total time by the number of operations recorded in VolumeReadOps or VolumeWriteOps.
Another critical indicator is VolumeQueueLength, which represents the number of I/O requests waiting to be serviced. For latency-sensitive applications like OLTP databases, this should ideally hover near 1. If it consistently exceeds 10, your volume is likely hitting its IOPS or throughput limit, causing requests to pile up and latency to soar. You should also watch VolumeThroughputPercentage; if this metric nears 100%, your workload is being throttled, which manifests as increased latency for any new requests.
Defining normal vs problematic latency
What qualifies as “normal” depends entirely on your volume type and workload pattern. For a general-purpose application running on gp3, 1–5ms is standard. If you are using io2 Block Express, you should expect average latencies under 500 microseconds for 16KiB I/O operations. io2 volumes deliver much more consistent latency characteristics, especially at higher thread counts, whereas gp3 may show more variance during mixed read/write workloads.
Latency becomes problematic when it deviates from your established baseline. For instance, if your RDS instance typically operates at 2ms latency but spikes to 50ms during snapshot operations, you are likely experiencing the background copy process’s impact on I/O. Similarly, volumes restored from snapshots may experience a “first-read penalty.” In these cases, latencies can jump to hundreds of milliseconds as data is lazy-loaded from S3, which can cause connection timeouts for sensitive databases.
Troubleshooting and tuning strategies
When latency spikes, the immediate instinct is to provision more IOPS. However, this is often unnecessary and expensive. You should first verify if your EC2 instance is the bottleneck. Smaller instances, like the t3.medium, deliver only 347 Mbps of baseline EBS bandwidth. If your instance is capped at this level, provisioning a gp3 volume for 1,000 MiB/s will result in significant latency because the “pipe” between the instance and the storage is physically too small.
Performance tuning through migration
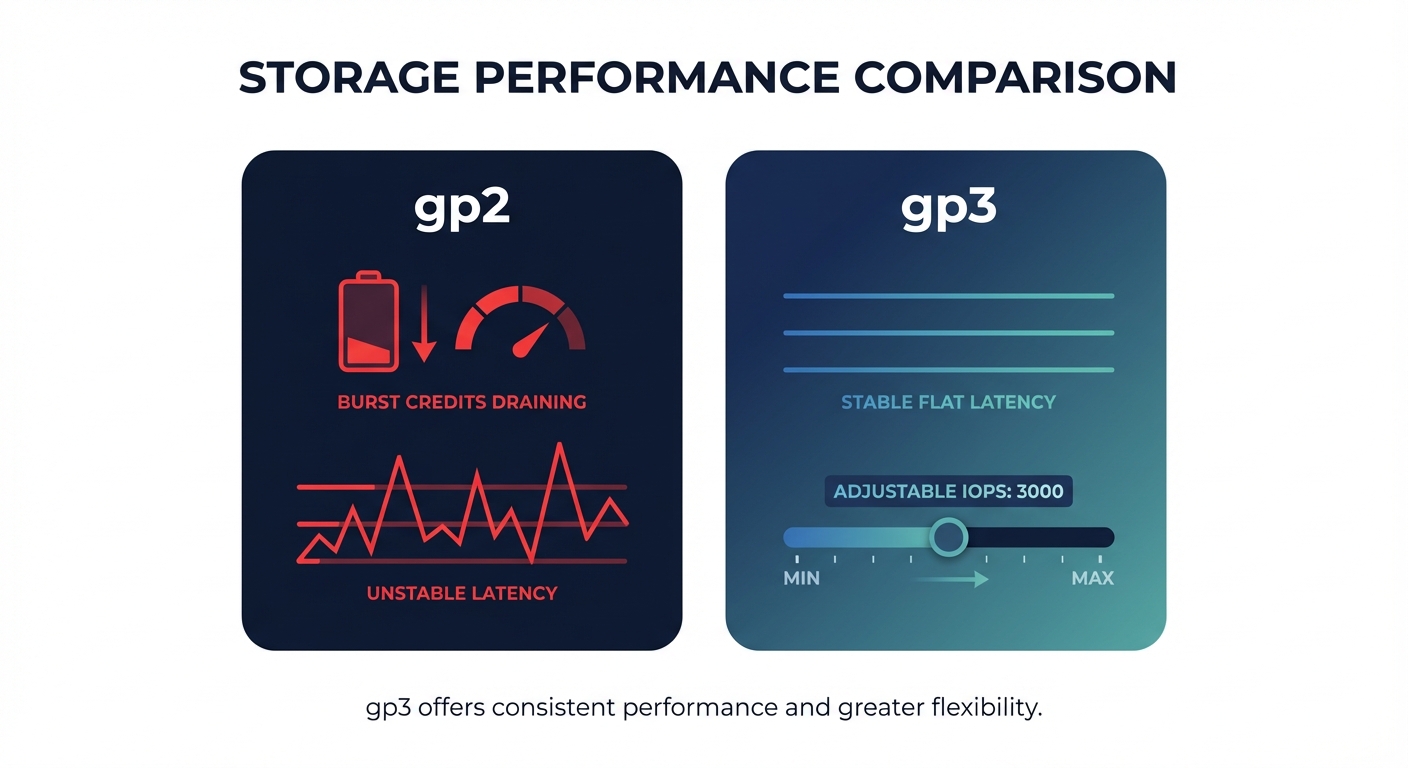
One of the most effective strategies for stabilizing performance is migrating from legacy gp2 volumes to gp3. Not only does gp3 decouple IOPS from storage size – allowing you to provision 3,000 IOPS even on a small 10 GB volume – but it also eliminates the unpredictable burst credit system that often leads to sudden performance cliffs. Following AWS EBS best practices by making this switch typically yields a 20% cost reduction while providing more predictable latency baselines.
Benchmarking and OS optimization
For high-performance Linux workloads, you can further tune performance by optimizing I/O queue depths and mount options. Using tools like fio benchmarking allows you to simulate your production workload and identify the optimal queue depth where throughput is maximized without causing a latency blowout. Monitoring the VolumeIdleTime metric can also help identify if you have unattached volumes that are adding to your costs without providing any performance benefit.
Automating performance and cost with Hykell
Maintaining the delicate balance between low latency and low cost is a full-time job for engineering teams. Hykell simplifies this by offering automated EBS and EC2 optimization that works on autopilot. Hykell monitors your actual usage patterns in real-time to identify overprovisioned IOPS and throughput that aren’t contributing to actual performance gains.
By dynamically right-sizing your volumes and recommending migrations – such as moving from expensive io1 or io2 volumes to tuned gp3 volumes – Hykell helps you reduce AWS storage costs by up to 40%. This ensures your workloads remain fast and cost-effective without manual intervention or the need for constant engineering effort. If you are ready to eliminate EBS bottlenecks and stop overpaying for performance you aren’t using, use the Hykell cost savings calculator to see how much you could save today.