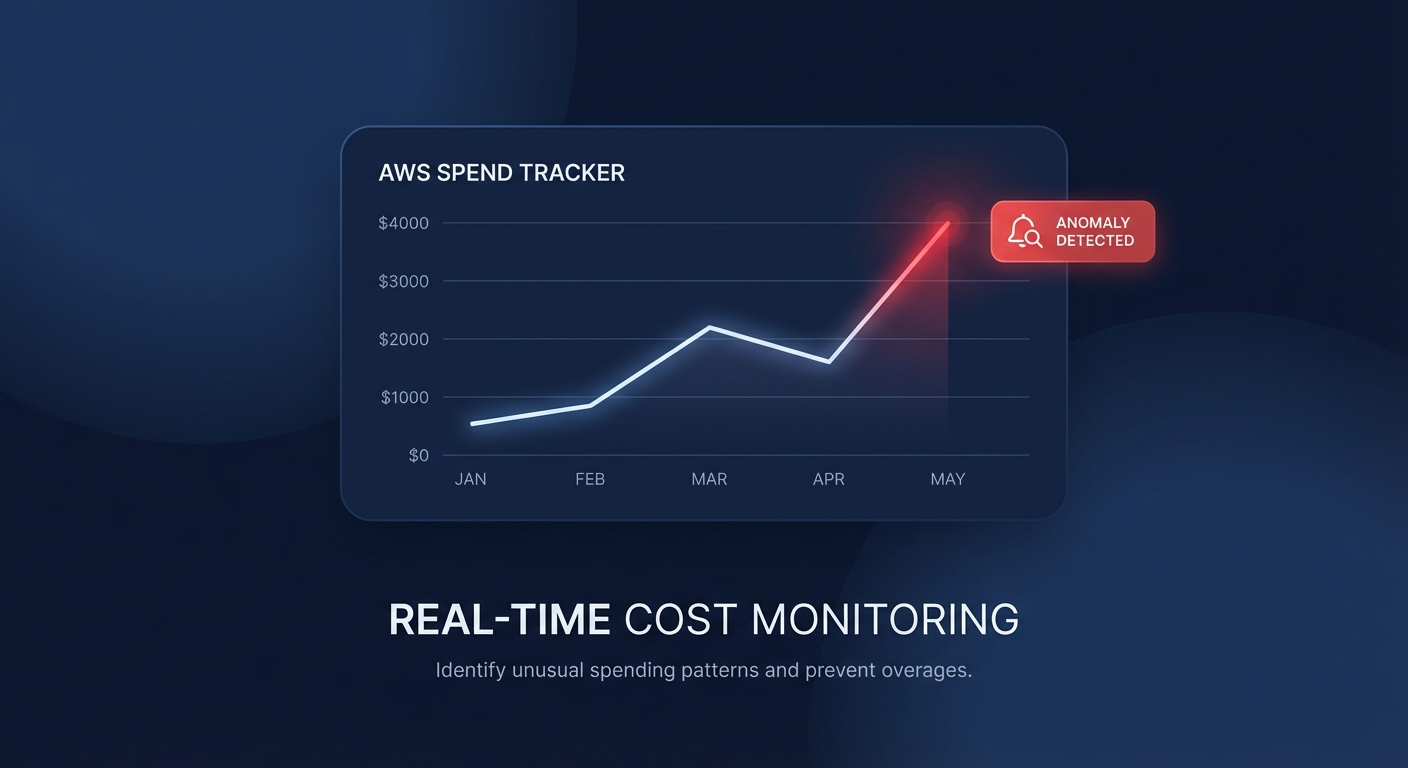
Ever been blindsided by a $10,000 Lambda spike discovered only at month-end? Manually clicking through the AWS console to set up monitors is a recipe for inconsistency, but you can automate your defense using Terraform to catch spend deviations before they wreck your budget.
Why engineer your cost monitoring with Terraform?
Infrastructure-as-Code (IaC) moves your FinOps strategy from reactive firefighting to proactive governance. When you define AWS Cost Anomaly Detection via Terraform, you ensure that every new account or project launched in your organization is born with a digital tripwire. Without this automation, engineering teams often “fly blind,” leading to unnecessary expenses that could have been mitigated within hours of a misconfiguration.
At Hykell, we’ve seen that organizations utilizing automated detection combined with continuous cost optimization can reduce their total AWS bill by up to 40%. Terraform provides the foundation for this by standardizing how you track resource usage and spending patterns across your entire environment.
Configuring the aws_ce_anomaly_monitor resource
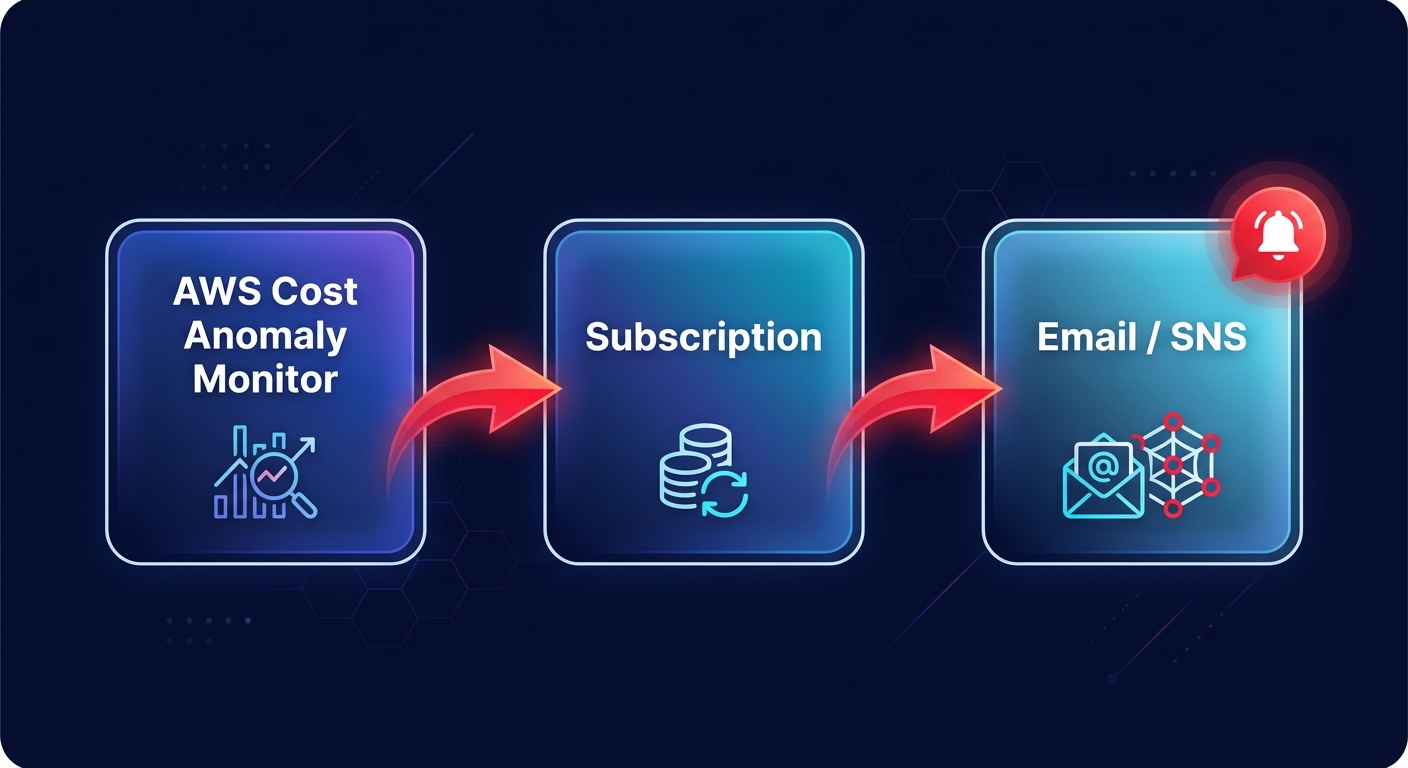
The `awsceanomaly_monitor` resource acts as the brain of your detection system. It leverages machine learning to analyze historical spending patterns and establish baselines without requiring manual threshold configuration. You can choose between two primary monitor types to suit your needs.
DIMENSIONAL monitors focus on specific AWS services or linked accounts, providing broad coverage for standard infrastructure. Conversely, CUSTOM monitors allow you to track specific cost allocation tags or cost categories, which is essential for multi-tenant environments or project-based billing. AWS recently updated its detection algorithm to use a rolling 24-hour window, enabling the system to identify anomalies significantly faster by comparing full 24-hour periods rather than waiting for incomplete calendar days to close.
“`hcl
resource “awsceanomalymonitor” “servicemonitor” {
name = “AWS-Service-Monitor”
monitor_type = “DIMENSIONAL”
monitor_dimension = “SERVICE”
}
“`
For high-growth teams, a managed monitor is often the superior choice. These managed monitors automatically include new linked accounts or cost categories as they are created, eliminating the “blank spot” risk when new teams spin up resources in your AWS Organization.
Routing alerts with aws_ce_anomaly_subscription
While a monitor identifies the problem, the `awsceanomaly_subscription` ensures the right person receives the notification. You can define thresholds based on an absolute dollar amount, such as $100, or a percentage-based deviation. To avoid alert fatigue, you should calibrate your subscription frequency. While “IMMEDIATE” alerts are standard for production environments, daily or weekly summaries might be more appropriate for development sandboxes where experimental spikes are expected.
“`hcl
resource “awsceanomalysubscription” “emailsubscription” {
name = “Critical-Spike-Alerts”
frequency = “IMMEDIATE”
monitorarnlist = [
awsceanomalymonitor.servicemonitor.arn
]
threshold_expression {
dimension {
key = “ANOMALYTOTALIMPACT_ABSOLUTE”
values = [“100”]
}
}
subscriber {
address = “finops-alerts@yourcompany.com”
type = “EMAIL”
}
}
“`
For more advanced workflows, you can route your alerts through Amazon SNS. This allows you to integrate with Slack via AWS Chatbot or trigger Lambda functions for automated remediation. For example, you could configure a function to automatically shut down unconditioned development instances if an anomaly is detected after business hours.
Multi-account patterns for FinOps practitioners
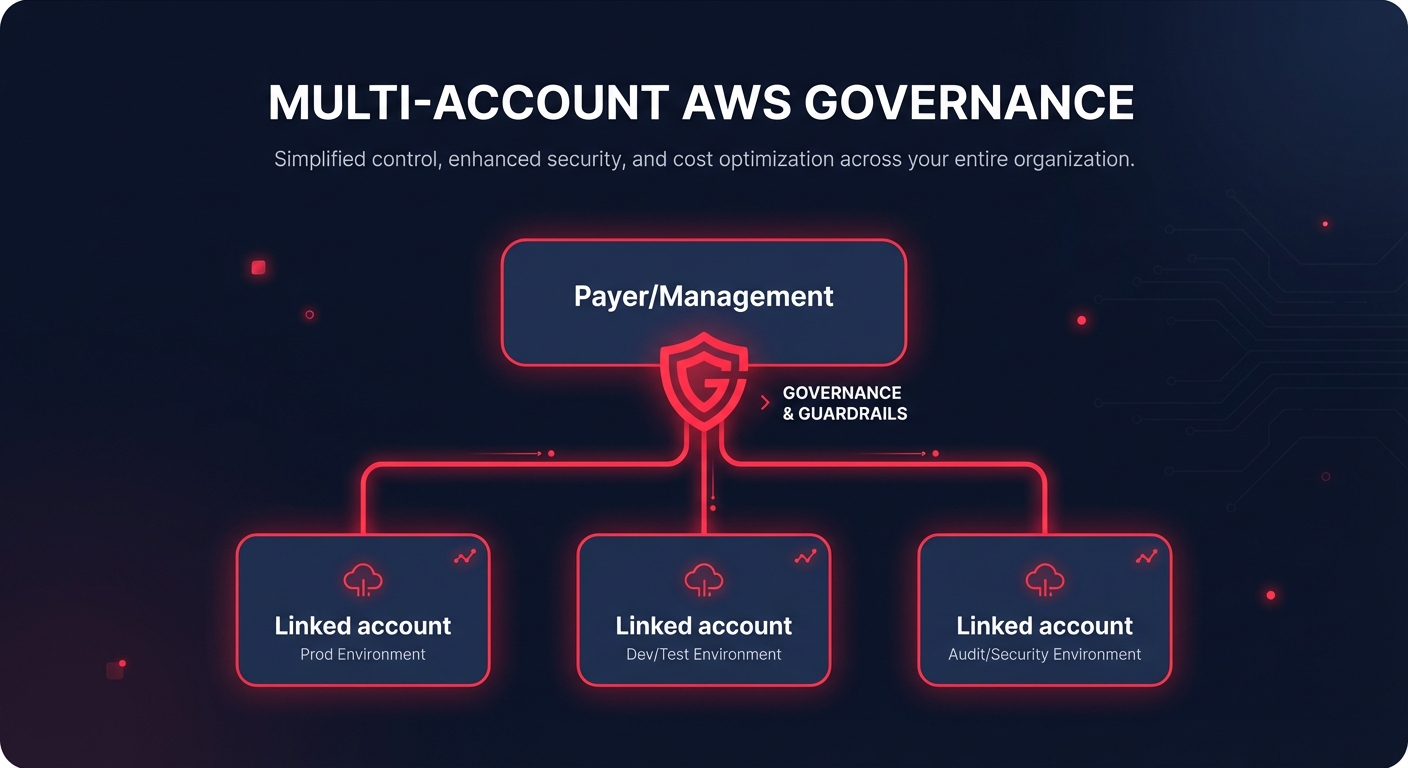
In a multi-account environment, centralized monitoring is the gold standard for financial visibility. You should deploy your monitors in the Management or Payer account to gain visibility across the entire Organization. This setup allows you to create managed monitors that track up to 10 linked accounts simultaneously.
When using Terraform for a multi-account strategy, you should consider creating a reusable module that accepts a list of account IDs or tags. This ensures that as you scale, your cloud cost auditing remains consistent and centralized.
- The Terraform execution role requires specific permissions, including `ce:CreateAnomalyMonitor` and `ce:CreateAnomalySubscription` in the target account.
- AWS processes billing data approximately three times daily with a typical 24-hour delay in net unblended cost data, meaning your alerts will catch spikes roughly one day after they occur.
- New monitors or monitors in new accounts require at least 10 days of historical data to establish an accurate machine learning baseline.
Best practices for automated monitoring
Calibrate your thresholds carefully to maintain a high signal-to-noise ratio. Starting with a threshold that is too low leads to “noise,” causing engineers to ignore alerts over time. Practitioners often start with a 30% or $500 threshold and tighten it to 10% or $100 once the ML model understands the account’s seasonality and growth patterns.
Always pair your anomaly detection with AWS Budgets. While anomaly detection finds the unexpected, budgets track your planned spend against a fixed limit. Using both ensures you have 360-degree coverage of your financial guardrails.
Terraform allows you to treat cost as a first-class citizen in your deployment pipeline. By automating these monitors, you empower your engineering team to become the first line of defense against cloud waste. If you find that manual reviews and basic alerts aren’t enough to keep your bill in check, Hykell can help you move from visibility to action by automating your AWS optimizations on autopilot. This approach ensures you only pay for the resources you truly need while maintaining peak performance. Calculate your potential savings with Hykell’s cost savings tool and see how much you could save without ongoing engineering effort.