Are you actually saving money with your Reserved Instances, or are you just pre-paying for waste? Most mid-to-large AWS users struggle with “commitment drift,” where infrastructure changes leave expensive reservations sitting idle while the monthly bill continues to climb.
The math of efficiency: utilization vs. coverage
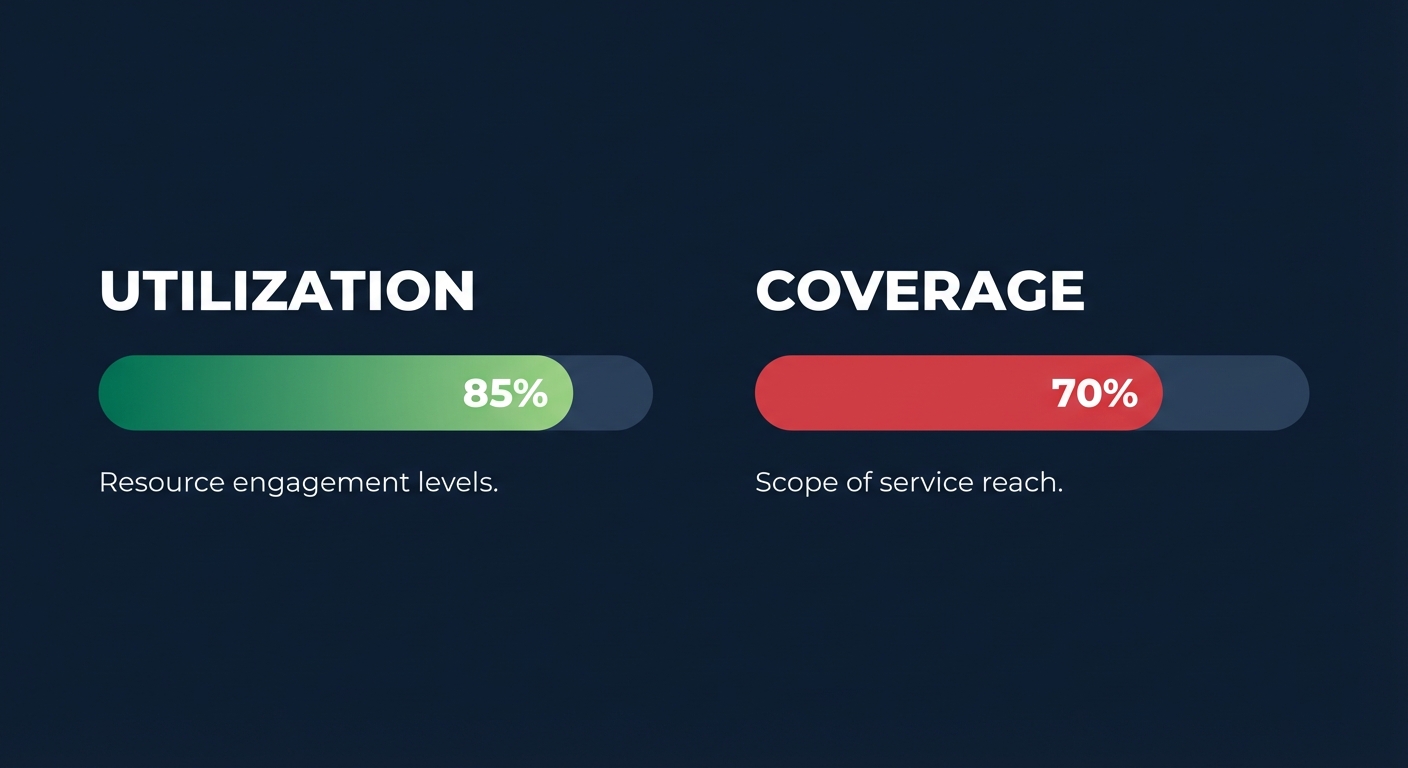
To audit your portfolio effectively, you must distinguish between two critical but often confused metrics. RI utilization measures the efficiency of the instances you have already bought, while RI coverage measures how much of your total fleet is actually benefiting from a discount.
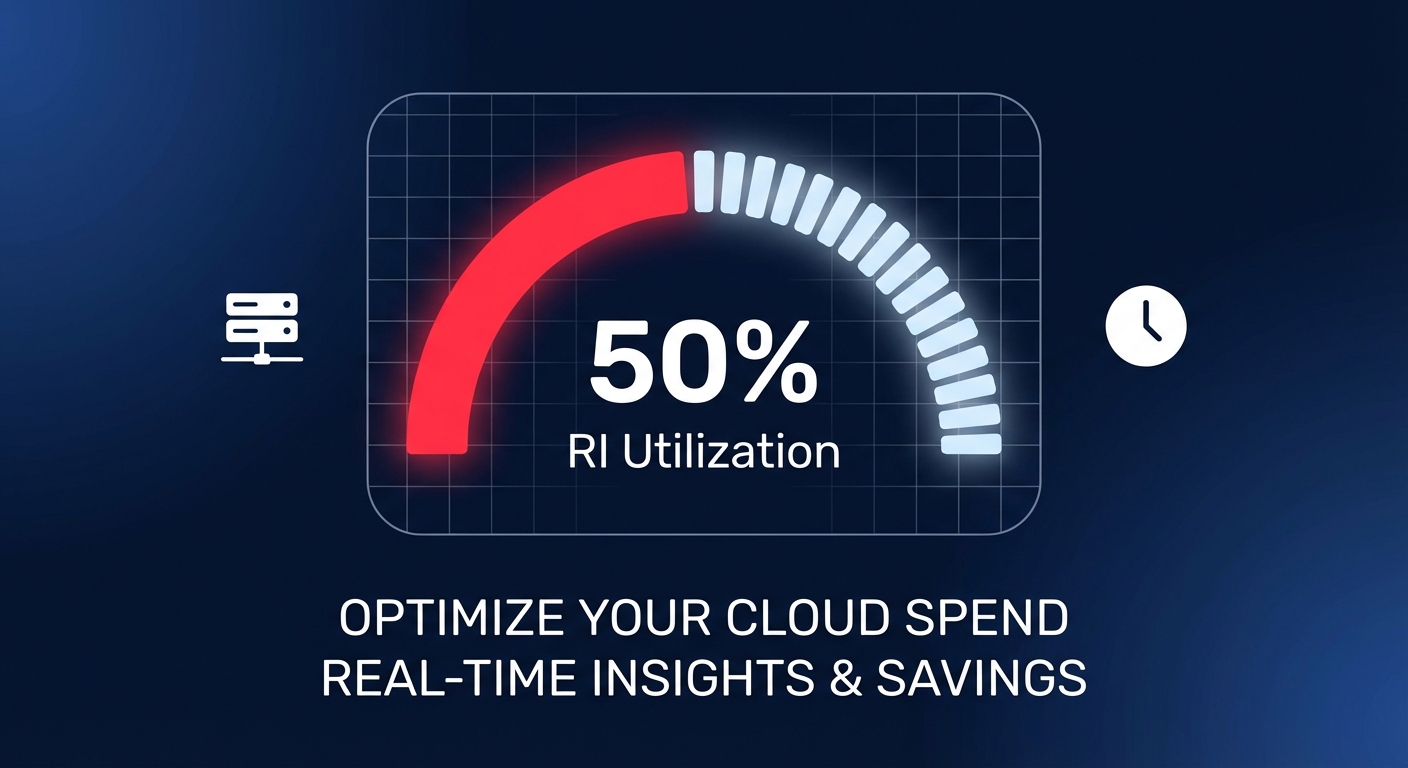
RI Utilization is calculated as (RI Usage Hours / Total RI Purchased Hours) × 100%. If you purchase a one-year RI for an m5.large but only run that instance for 12 hours a day, your utilization is 50%. Since you paid for 24 hours of availability, your effective discount is slashed in half. For a healthy environment, you should target an RI utilization of 85% or higher. Anything below 70% suggests you are over-committed and losing money on capacity you don’t use.
RI Coverage is calculated as (RI Usage Hours / Total Instance Usage Hours) × 100%. This tells you what percentage of your running fleet is covered by a commitment versus running at on-demand pricing. You should generally aim for a coverage rate of at least 70% to ensure you aren’t overpaying for steady-state workloads.
Navigating the audit with native tools
The first step in a comprehensive cloud cost audit is gathering the right data. AWS provides two primary lenses for this analysis:
- AWS Cost Explorer: This is your primary tool for a high-level retrospective. It provides up to 38 months of historical data and specific reports for both utilization and coverage. You can filter by member account, instance family, and region to see exactly where your utilization is dipping.
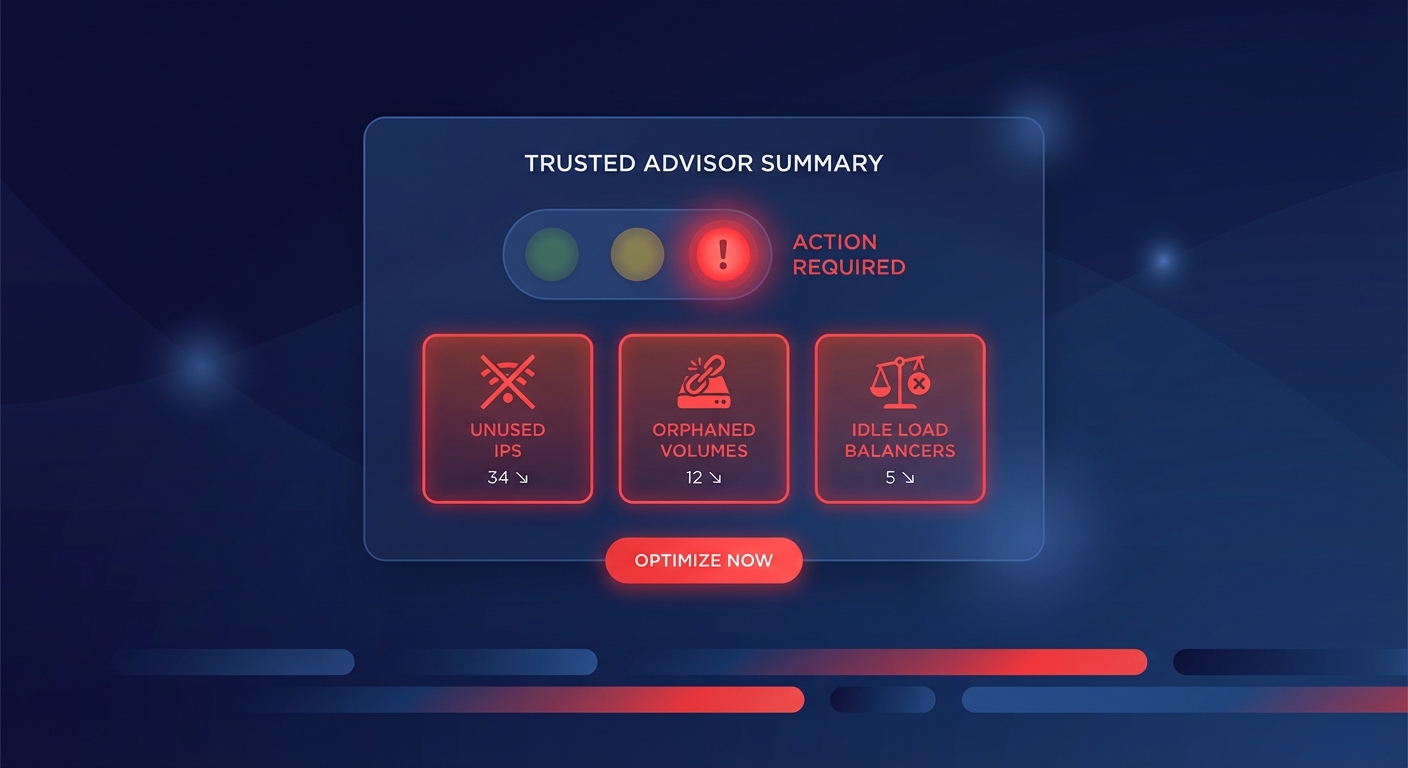
- Cost and Usage Report (CUR): For a deep-dive audit, the CUR is essential. It provides granular, resource-level data that reveals exactly which instance ID consumed which discount hour. By querying the CUR with Amazon Athena, you can identify “orphaned” RIs – reservations that are active but no longer match any running instances due to a shift in instance family, such as a migration from m5 to m6g.
Identifying the break-even failure
A successful audit must answer a blunt question: Is this commitment actually cheaper than On-Demand? You can calculate the break-even point with the formula: Break-even Point = (1 – RI Discount Rate) × RI Term.
Consider a one-year No Upfront Reserved Instance with a 29% discount. This commitment has a break-even point of roughly 8.5 months. If your workload only runs for seven months out of the year, that “discounted” instance actually costs you more than if you had stayed on On-Demand. During your audit, you should flag any RI where the utilization percentage is lower than the discount rate, as these are primary candidates for modification or sale on the AWS Reserved Instance Marketplace.
Why manual audits usually fail at scale
Even with perfect visibility, manual management is a losing game for large organizations. Engineering teams often spend 10–15% of their time playing “RI Tetris,” trying to match reservations to shifting workloads. This manual approach typically only captures a fraction of potential savings because of several structural challenges.
RIs are often locked to specific regions or instance families. Standard RIs cannot be changed when you upgrade to newer generation hardware, and selling unused commitments on the Marketplace requires active pricing adjustments and timing that most DevOps teams cannot manage alongside their core responsibilities. Without constant attention, these rigid commitments quickly become technical debt.
Automating RI utilization with Hykell
The most effective way to audit and optimize your portfolio is to move beyond manual spreadsheets. Hykell provides automated RI management that functions like a high-frequency trading platform for your cloud costs, ensuring your commitments always align with your actual usage.
Hykell’s AI-powered engine continuously monitors your usage patterns across every region and account. When it detects an underutilized RI, it takes immediate action by automatically converting Reserved Instances and Savings Plans to match your current instance families. It can also list unused Standard RIs on the Marketplace at optimal price points to recoup your capital.
By blending RIs, Savings Plans, and Spot instances, Hykell customers typically achieve an Effective Savings Rate (ESR) of 50–70%. Because Hykell operates on a performance-based model, you only pay a slice of the savings generated – if you don’t save money, you don’t pay.
Stop guessing if your reservations are working. You can calculate your potential savings today and let Hykell put your cloud cost optimization on autopilot.