Is your engineering team spending more time reviewing AWS bills than shipping features? Most organizations lose 30% of their cloud budget to waste, but you can reclaim those funds and improve performance without adding a single hour to your DevOps roadmap.
The blueprint for ongoing cloud optimization
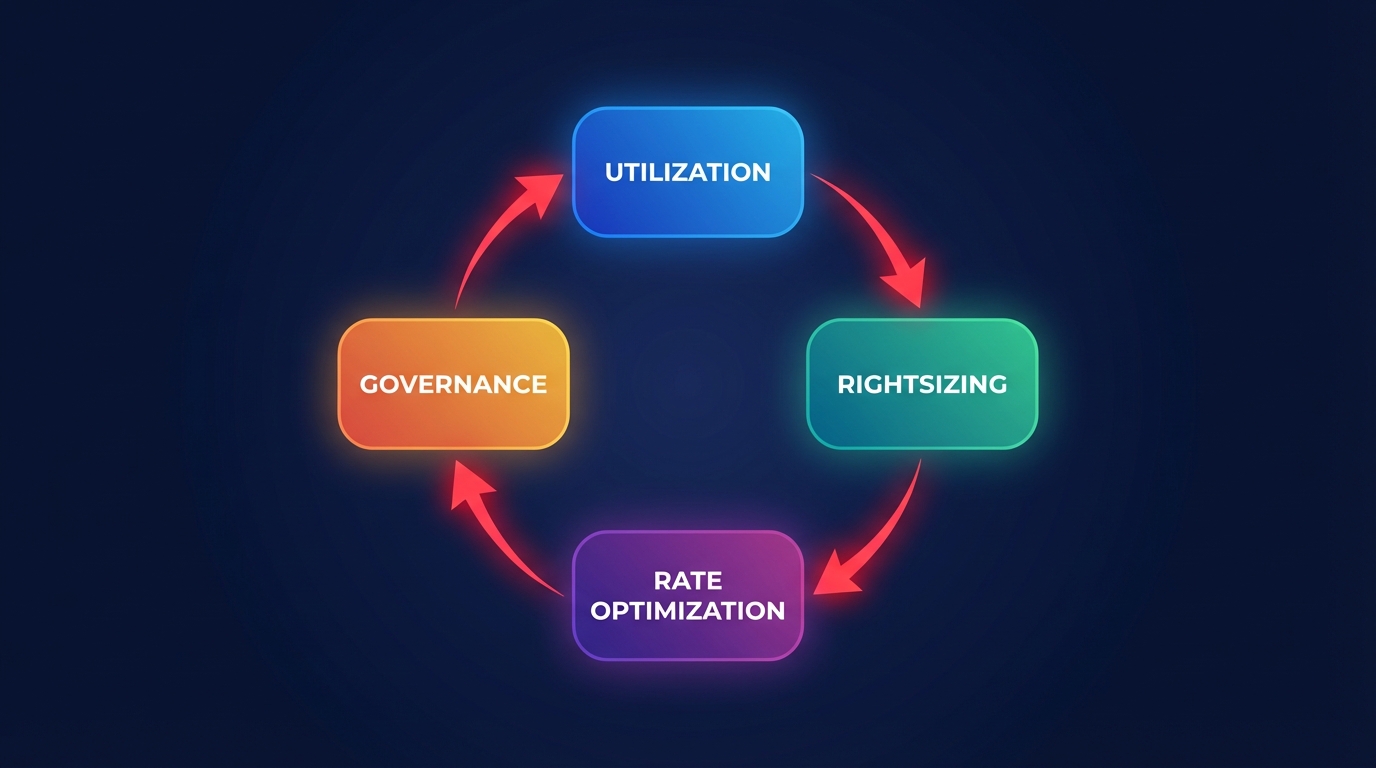
A successful AWS cloud optimization program is not a one-time audit; it is a continuous cycle of disciplines that balance performance with cost-efficiency. To achieve a 40% reduction in spend, you must address four critical areas: utilization, rightsizing, rate optimization, and governance. This iterative process allows your team to move away from manual “t-shirt sizing” and transition to data-driven, automated adjustments that scale with your infrastructure.
By layering these strategies, you create a compounding effect that yields far greater results than isolated fixes. For instance, a UK government department achieved over 55% total savings by combining strategic AWS discount layers with Graviton migrations and aggressive rightsizing. This approach follows the core phases of a comprehensive FinOps framework, moving through the stages of visibility, action, and continuous automation.
Rightsizing compute and storage for peak utilization
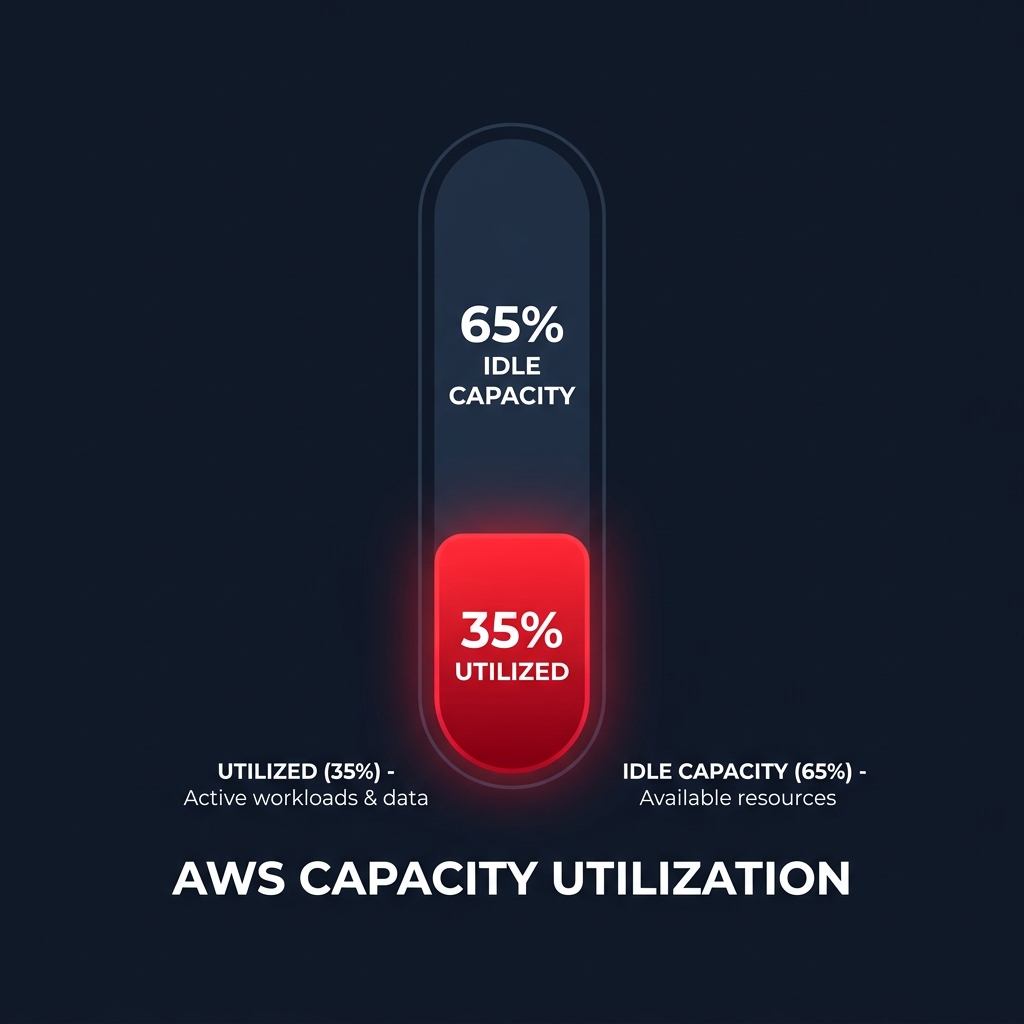
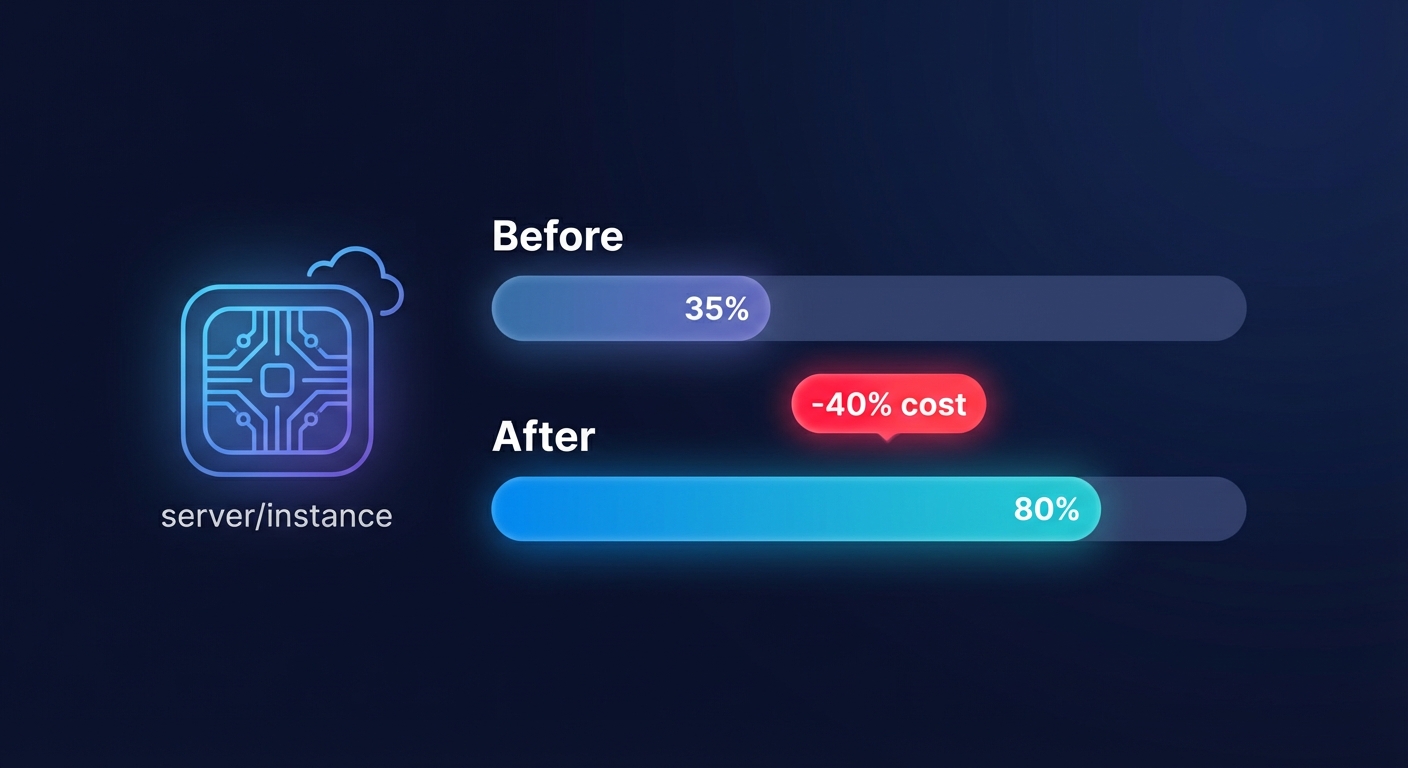
Most AWS environments run at a meager 30–40% utilization, which effectively means you are paying for idle capacity that serves no business purpose. Rightsizing is the fundamental process of matching your instance types and sizes to your actual workload requirements at the lowest possible cost.
When you implement automated AWS rightsizing, you move beyond simple CPU metrics. You should analyze P99 utilization over 14–30 days to identify downsizing candidates with precision. Moving from a memory-intensive t3.xlarge to an r6g.large can yield immediate 40% savings, especially when leveraging AWS Graviton processors, which offer up to 40% better price-performance than legacy Intel-based instances.
Storage is another frequent source of unchecked budget bloat. Many teams provision gp3 volumes with 3,000 IOPS by default, even when workloads rarely exceed 100 IOPS. Transitioning from older gp2 volumes to gp3 and optimizing IOPS and throughput can reduce storage costs by 30–40% without impacting application latency or performance.
Automating rate optimization and commitments
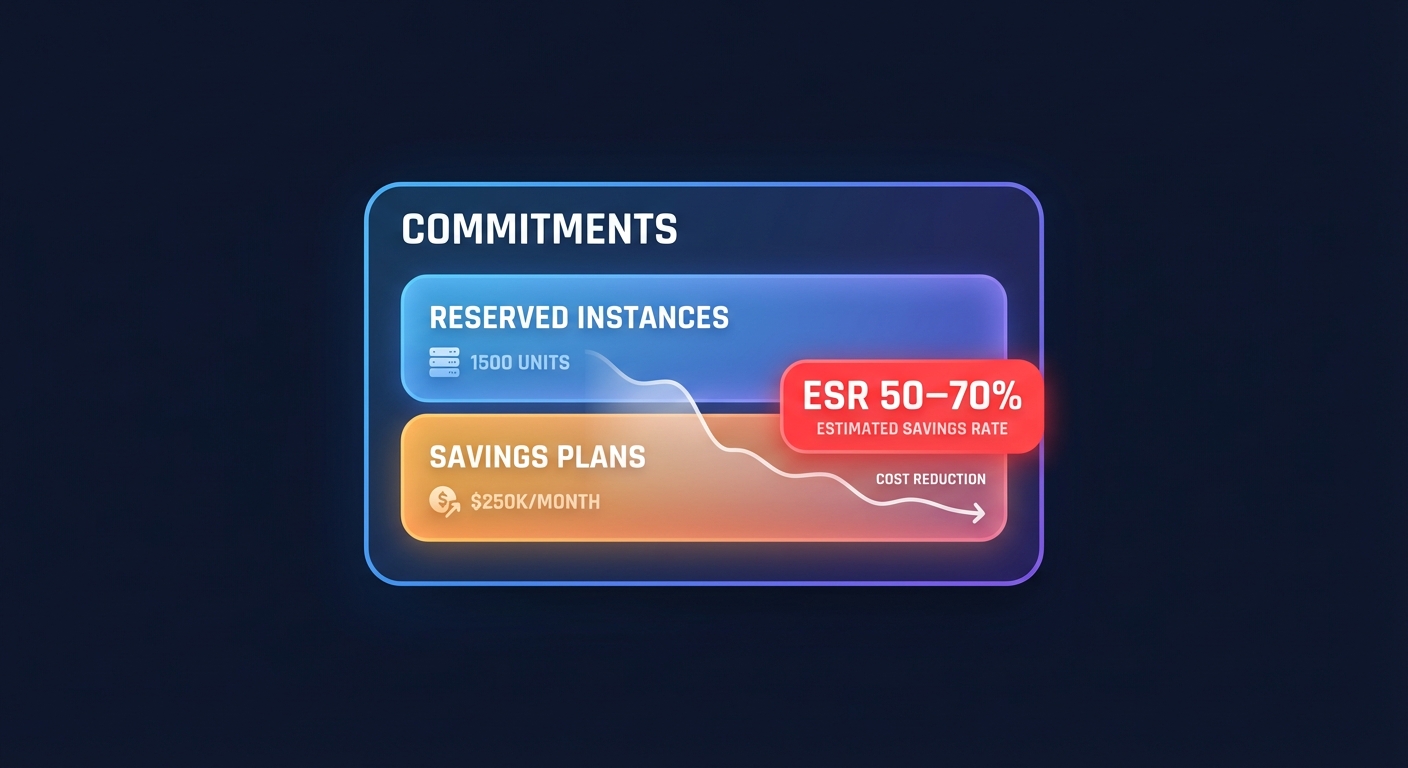
While rightsizing reduces the quantity of resources you use, rate optimization reduces the price you pay for them. AWS offers discounts of up to 72% through Reserved Instances (RIs) and Savings Plans. However, manual management of these instruments often leads to “commitment lock-in” or wasted spend on unused reservations when workloads shift.
To maximize your AWS rate optimization, you need an AI-driven approach that manages a blended portfolio of commitments. Instead of locking your organization into rigid three-year plans that may not fit your needs in twelve months, an automated system can buy, sell, and convert RIs and Savings Plans in real-time. This dynamic strategy helps you achieve an Effective Savings Rate (ESR) of 50–70%, which is often double what manual teams achieve through traditional forecasting.
Implementing automated governance and observability
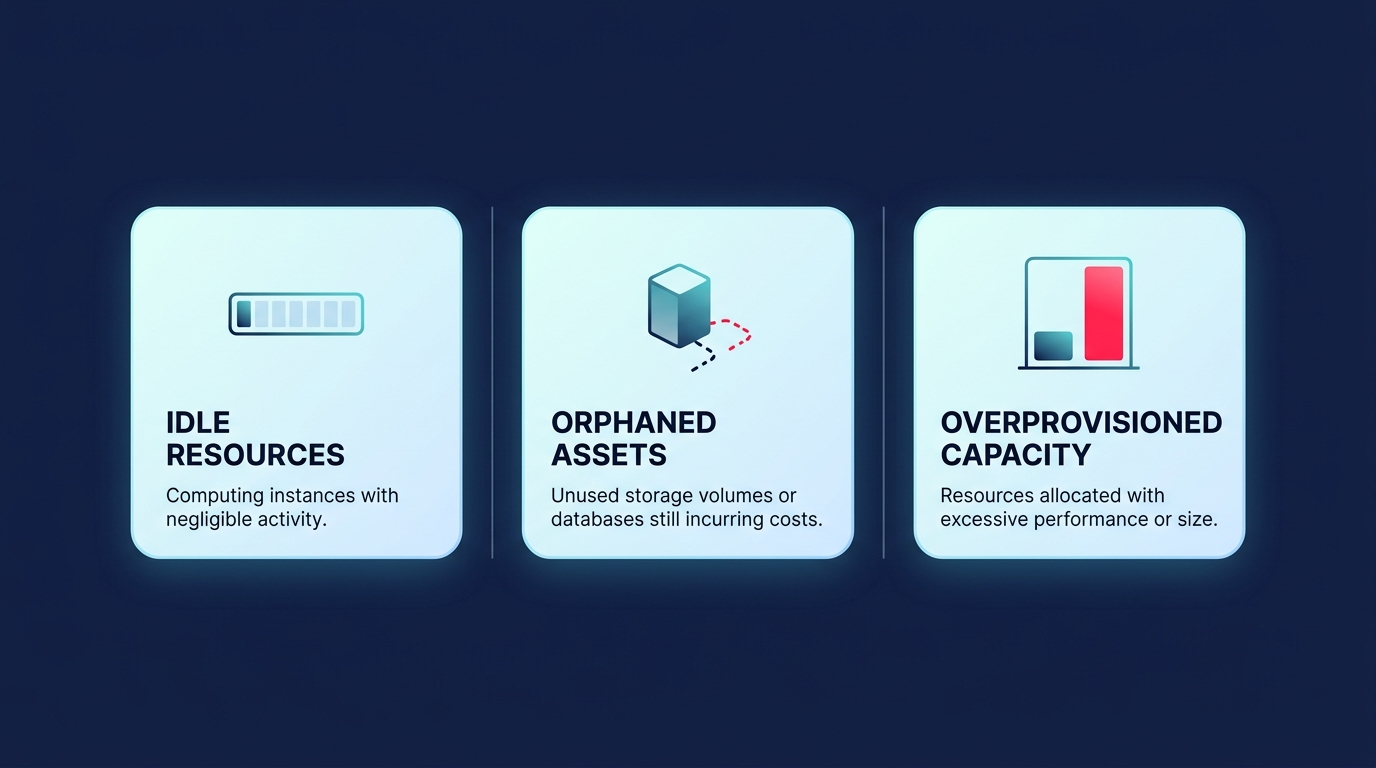
You cannot optimize what you cannot see. Robust governance starts with a strict tagging taxonomy for cost allocation that converts raw invoices into actionable business data. By mapping spend to specific owners, environments, and applications, you can hold teams accountable and identify “zombie” resources – such as unattached EBS volumes or orphaned snapshots – that contribute to significant cost bloat.
Beyond tagging, you should deploy automated cost anomaly detection to catch spending spikes before they balloon into five-figure surprises. While native tools like AWS Cost Explorer provide essential visibility into historical trends, they are primarily retrospective. High-growth teams require real-time cloud observability to spot underutilized resources in seconds and validate the impact of optimizations as they occur.
Scaling your program without engineering overhead
The biggest hurdle to cloud optimization is rarely a lack of data; it is a lack of engineering bandwidth. Manual cost management is a losing battle for growing DevOps teams, as weekly billing reviews and manual instance resizing quickly hit diminishing returns and distract from core product development.
Hykell solves this by putting your AWS savings on autopilot. By integrating directly with your environment via read-only roles, the Hykell platform continuously identifies inefficiencies across EC2, Fargate, and RDS. It executes high-impact optimizations – such as automated EBS tuning, instance rightsizing, and commitment rebalancing – without requiring code changes or internal engineering effort.
This approach creates a sustainable program that reduces your total AWS spend by up to 40% while maintaining 100% performance integrity. Because Hykell uses performance-based pricing, there are no upfront costs; you only pay a portion of the actual savings realized in your monthly bill.
Uncover the hidden efficiency in your infrastructure and see how much you could reclaim by using our automated cloud cost analysis tool today.