Cloud costs can spiral out of control without proper visibility. If you’re struggling to track AWS spending across multiple services and accounts, an automated cost dashboard might be the solution you need. Let’s explore how to build one that delivers real savings.
Why you need an automated AWS cost dashboard
Managing AWS costs manually is like trying to track household expenses with sticky notes—inefficient and prone to errors. It’s not just about seeing numbers; it’s about transforming raw data into actionable intelligence that drives meaningful savings.
Automated dashboards provide:
- Real-time visibility into spending across all services
- Early detection of cost anomalies before they become financial disasters
- Data-driven insights for optimization opportunities
- Accountability across teams and departments
The impact can be substantial. A retail company reduced cloud expenses by 25% after implementing automated cost visualization tools, while a global logistics firm achieved a 30% reduction through similar automation strategies. These aren’t just incremental improvements—they represent transformative financial outcomes.
Essential components for your AWS cost dashboard
1. Data collection and integration
Start by centralizing your cost data from various sources:
- AWS Cost Explorer: Provides historical spending data and forecasting capabilities, allowing you to drill down into service-specific costs
- AWS Cost and Usage Reports (CUR): Delivers detailed usage data at hourly or daily intervals—essential for granular analysis
- AWS Budgets: Monitors spending against predefined thresholds, creating guardrails around your cloud expenses
- CloudWatch metrics: Captures performance data to correlate with costs, helping you understand the relationship between resource utilization and spending
For multi-account setups, use AWS Organizations with consolidated billing to streamline data collection. This creates a unified view of spending across your entire AWS footprint, eliminating blind spots that often hide costly inefficiencies.
2. Visualization tools
Several options exist for building your dashboard:
- Amazon QuickSight: AWS’s native business intelligence service with pre-built Cost Intelligence Dashboard templates that can be deployed in minutes
- Grafana: Open-source platform that connects to multiple data sources for customizable visualizations. Grafana vs Datadog pricing comparisons show Grafana is often more cost-effective for visualization-focused needs.
- AWS Cost Optimization Hub: Centralizes recommendations and savings opportunities in one interface, providing estimated savings calculations for rightsizing, idle resource cleanup, and Savings Plans
Real-world impact: A construction machinery company in the US saved $12,000 monthly by using QuickSight dashboards to identify inefficient storage retention policies—proving that visualizing the right metrics leads directly to bottom-line savings.
3. Automation capabilities
The real power comes from automation:
- Scheduled data refreshes: Ensure dashboards reflect current spending without manual intervention
- Anomaly detection: Configure alerts when costs exceed expected patterns, using machine learning to identify unusual spending behaviors
- Automated reporting: Schedule regular reports for stakeholders, keeping cost awareness top of mind across the organization
- Action triggers: Set up automated responses to cost issues (e.g., tagging enforcement, resource scaling)
Automation transforms cost management from a reactive, manual process into a proactive system that identifies and addresses issues before they impact your bottom line.
Building your dashboard: Step-by-step approach
1. Define your metrics and KPIs
Start with clear objectives:
- Cost allocation: Track spending by team, project, or business unit to create accountability
- Utilization metrics: Identify underused resources that represent immediate savings opportunities
- Optimization opportunities: Highlight potential savings through rightsizing, Reserved Instances, or Savings Plans
- Trend analysis: Monitor spending patterns over time to predict and prevent budget overruns
Consider the experience of an educational tech firm that saved $23,000 monthly by focusing on compute right-sizing opportunities identified through their dashboard. Their success came from tracking the right metrics—specifically, EC2 instance utilization patterns that revealed oversized resources.
2. Set up data pipelines
Create automated flows to process your cost data:
“`
AWS CUR → S3 → AWS Glue → Amazon Athena → QuickSight
“`
This serverless architecture ensures your dashboard always has fresh data without manual intervention. The pipeline transforms raw billing data into structured datasets that power your visualizations, with each component handling a specific part of the data processing workflow:
- S3 stores the raw cost and usage reports
- AWS Glue creates a schema and catalogs the data
- Athena provides SQL query capabilities against the data
- QuickSight visualizes the insights in an interactive dashboard
3. Build visualization widgets
Effective dashboards include:
- Service breakdown charts: Visualize costs by service, helping you identify which AWS offerings consume the largest portions of your budget
- Trend graphs: Show spending patterns over time, highlighting seasonal variations or unexpected growth
- Savings opportunity cards: Highlight potential optimizations with estimated dollar values
- Resource utilization heatmaps: Identify underused resources through visual patterns
- Commitment discount coverage: Track Reserved Instance and Savings Plan utilization to ensure you’re maximizing these discount mechanisms
The key is creating visualizations that transform complex cost data into clear, actionable insights—making financial decisions obvious rather than obscure.
4. Implement alerting and anomaly detection
Configure the system to notify you of unusual activity:
- Budget alerts: Notify when spending approaches thresholds, giving you time to intervene before overruns
- Anomaly detection: Use AWS Cost Anomaly Detection to identify unexpected spending patterns using AI/ML capabilities
- Scheduled reports: Automate delivery of insights to stakeholders, ensuring cost awareness becomes part of your organizational culture
A security solutions company reduced EC2 spend by $20,000 monthly after implementing hourly compute visualizations in their dashboard. The key to their success was rapid alerting that identified a development environment running unnecessary instances during off-hours.
5. Connect to optimization tools
For maximum impact, integrate your dashboard with optimization solutions:
- AWS Cost Optimization Hub: Provides centralized recommendations for savings with side-by-side strategy comparisons
- Rightsizing tools: Identify over-provisioned resources based on actual usage patterns
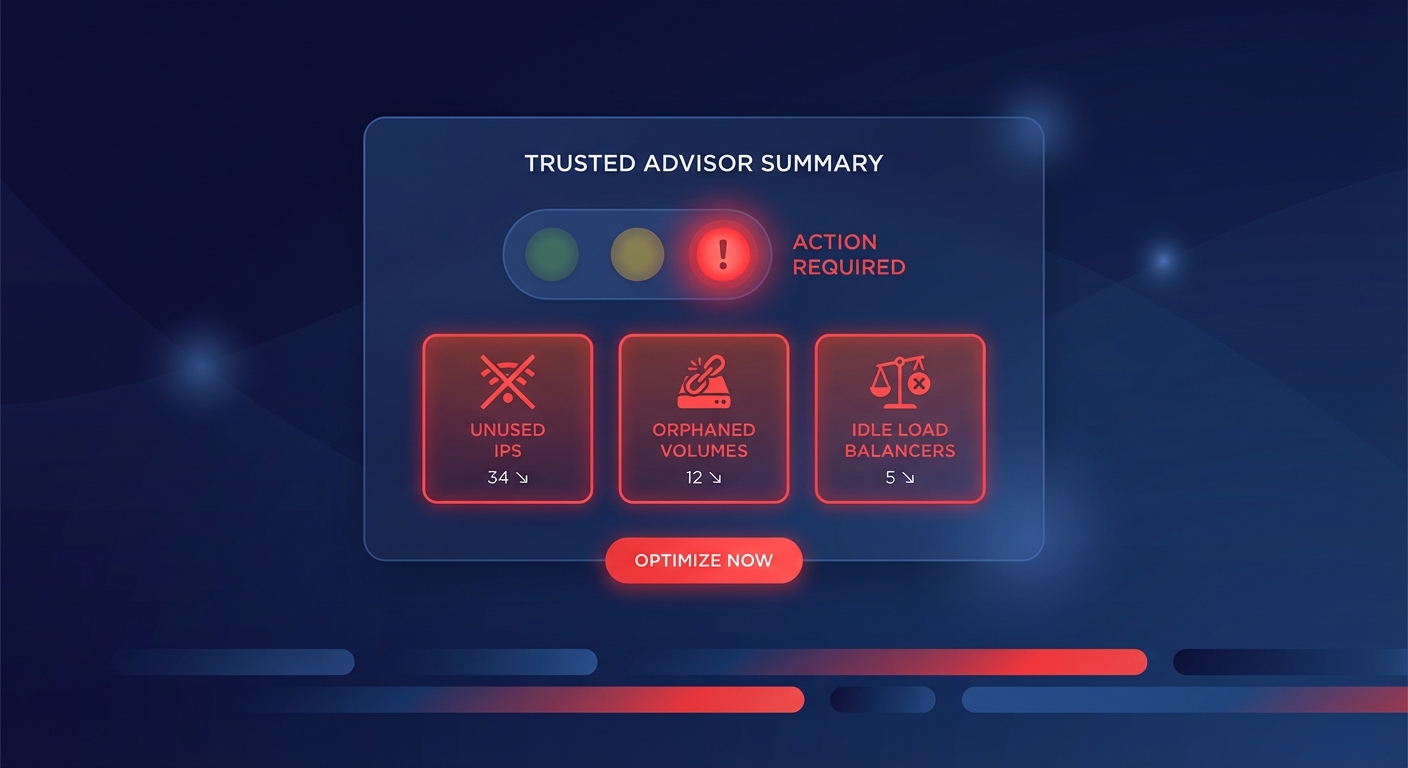
- Idle resource detection: Find and eliminate unused assets that continue to incur charges
Integration ensures you don’t just see problems—you have pathways to solve them. The dashboard becomes a command center for cost optimization rather than just a reporting tool.
Advanced dashboard strategies
Multi-cloud visibility
If you’re using multiple cloud providers alongside AWS, consider:
- Cloud-agnostic tools: Solutions that can ingest data from multiple providers for unified reporting
- Normalized metrics: Standardize cost data across platforms to enable apples-to-apples comparisons
- Consolidated reporting: Create unified views of all cloud spending to eliminate blind spots
This approach prevents cost shifting—where optimizations in one cloud environment inadvertently increase spending in another.
Kubernetes cost visibility
For organizations running containerized workloads, specialized dashboards can help manage Kubernetes cloud cost management by:
- Tracking pod-level resource utilization and mapping it to actual cloud costs
- Allocating costs to namespaces and labels to identify which applications or teams drive spending
- Identifying idle or over-provisioned containers that waste resources
Container environments often create unique cost challenges, as resources are abstracted away from the underlying infrastructure. Purpose-built visualizations bridge this gap, bringing financial clarity to complex Kubernetes deployments.
FinOps integration
Connect your dashboard to broader financial operations:
- Chargeback mechanisms: Bill internal teams for their cloud usage, creating direct financial accountability
- Budget forecasting: Predict future spending based on trends and planned initiatives
- Business value correlation: Link cloud costs to business outcomes, translating technical metrics into business impact
This integration shifts the conversation from “how much are we spending?” to “what value are we getting for our cloud investment?”—a much more strategic perspective.
Automating cost optimization with Hykell
While dashboards provide visibility, true savings come from taking action. Hykell automates AWS cost optimization by:
- Continuously monitoring for savings opportunities across compute, storage, and networking
- Automatically implementing optimizations without disrupting workloads or requiring engineering time
- Providing detailed tracking of implemented savings with before/after comparisons
Unlike manual approaches that require constant attention, Hykell’s automation can reduce AWS costs by up to 40% without ongoing engineering effort. The system works continuously in the background, identifying and implementing savings opportunities that would otherwise go unnoticed or unaddressed due to limited time and resources.
Getting started today
- Begin with AWS Cost Explorer: Gain initial visibility into your spending patterns across services
- Implement basic tagging: Ensure resources are properly categorized to enable meaningful analysis
- Set up AWS Budgets: Create alerts for spending thresholds to prevent unexpected overruns
- Build a simple QuickSight dashboard: Start with the Cost Intelligence Dashboard template for immediate insights
- Gradually add automation: Implement automated responses to cost issues as your confidence grows
Remember that the most effective dashboards evolve over time as your cloud usage and cost management strategies mature. Start simple, prove value, and expand your capabilities incrementally.
By combining automated dashboards with proactive optimization, you can transform cost management from a reactive exercise to a strategic advantage—saving money while maintaining or improving performance. The dashboard becomes not just a reporting tool but a central part of your financial governance strategy for the cloud.