Why is your AWS bill ballooning while your application feels sluggish? Most teams try to “scale” their way out of latency, but throwing more compute at a configuration bottleneck only drains your budget without fixing the root cause.
Cloud performance is a balancing act between resource saturation and financial efficiency. When your P99 latency spikes or throughput plateaus, you need a systematic way to isolate the bottleneck without doubling your monthly spend. You must move from reactive firefighting to a diagnostic approach that identifies whether your infrastructure is truly under-provisioned or simply misconfigured.
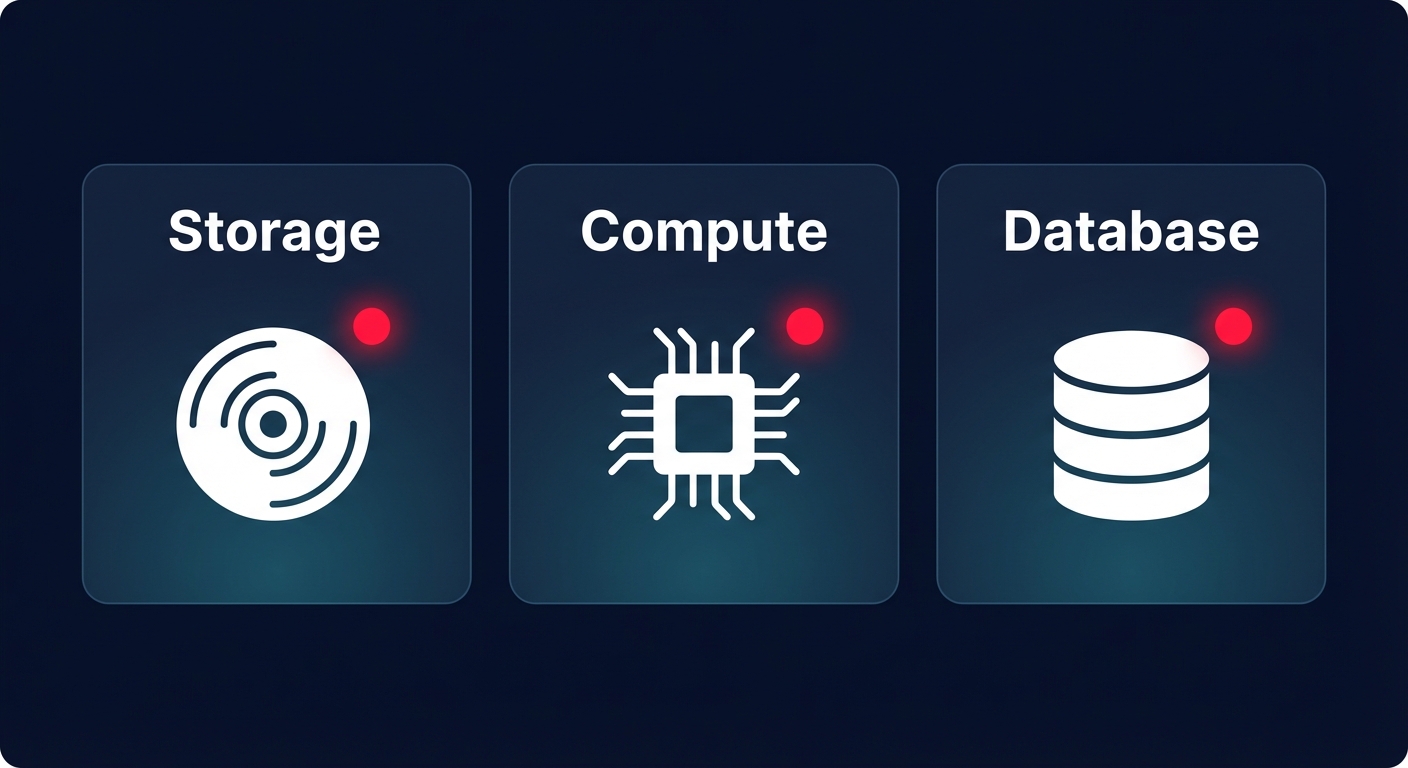
Identify the symptoms: Where is the bottleneck hiding?
Before diving into logs, you should categorize the performance degradation based on how it manifests in your environment. Most AWS performance issues fall into three primary categories: storage latency, compute saturation, or database wait events.
Storage latency and EBS bottlenecks
If your application feels unresponsive during database writes or file processing, the culprit is often your Elastic Block Store (EBS) configuration. Amazon EBS latency is the time between an application issuing an I/O request and its completion. High latency often results from hitting provisioned IOPS or throughput limits, especially on gp3 volumes where these can be scaled independently.
On older gp2 volumes, burst credit depletion can cause sudden “performance cliffs.” For volumes under 1 TiB, gp2 might burst to 3,000 IOPS but eventually drop to a much lower baseline once credits are exhausted. To diagnose this, monitor your `VolumeQueueLength` in CloudWatch; if this number is consistently high, your volume is struggling to keep up with the demand. Transitioning to gp3 is often a logical next step because it decouples IOPS from capacity and is typically 20% cheaper per GiB than gp2.
Compute saturation and scaling lag
Compute issues often look like high CPU utilization (consistently above 90%), but low CPU usage paired with high latency can be more deceptive. This pattern frequently indicates memory pressure, network throttling, or inefficient EC2 performance tuning regarding instance families. For instance, choosing a compute-optimized instance for a memory-intensive task will lead to paging and performance degradation regardless of how many vCPUs you add.
Scaling strategies also play a critical role. If your fleet is too reactive, you will suffer from “cold start” latency as new instances join the fleet too late to handle traffic spikes. Following AWS EC2 auto scaling best practices means utilizing target tracking policies based on meaningful metrics – like ALB request counts per target – rather than just relying on CPU averages.
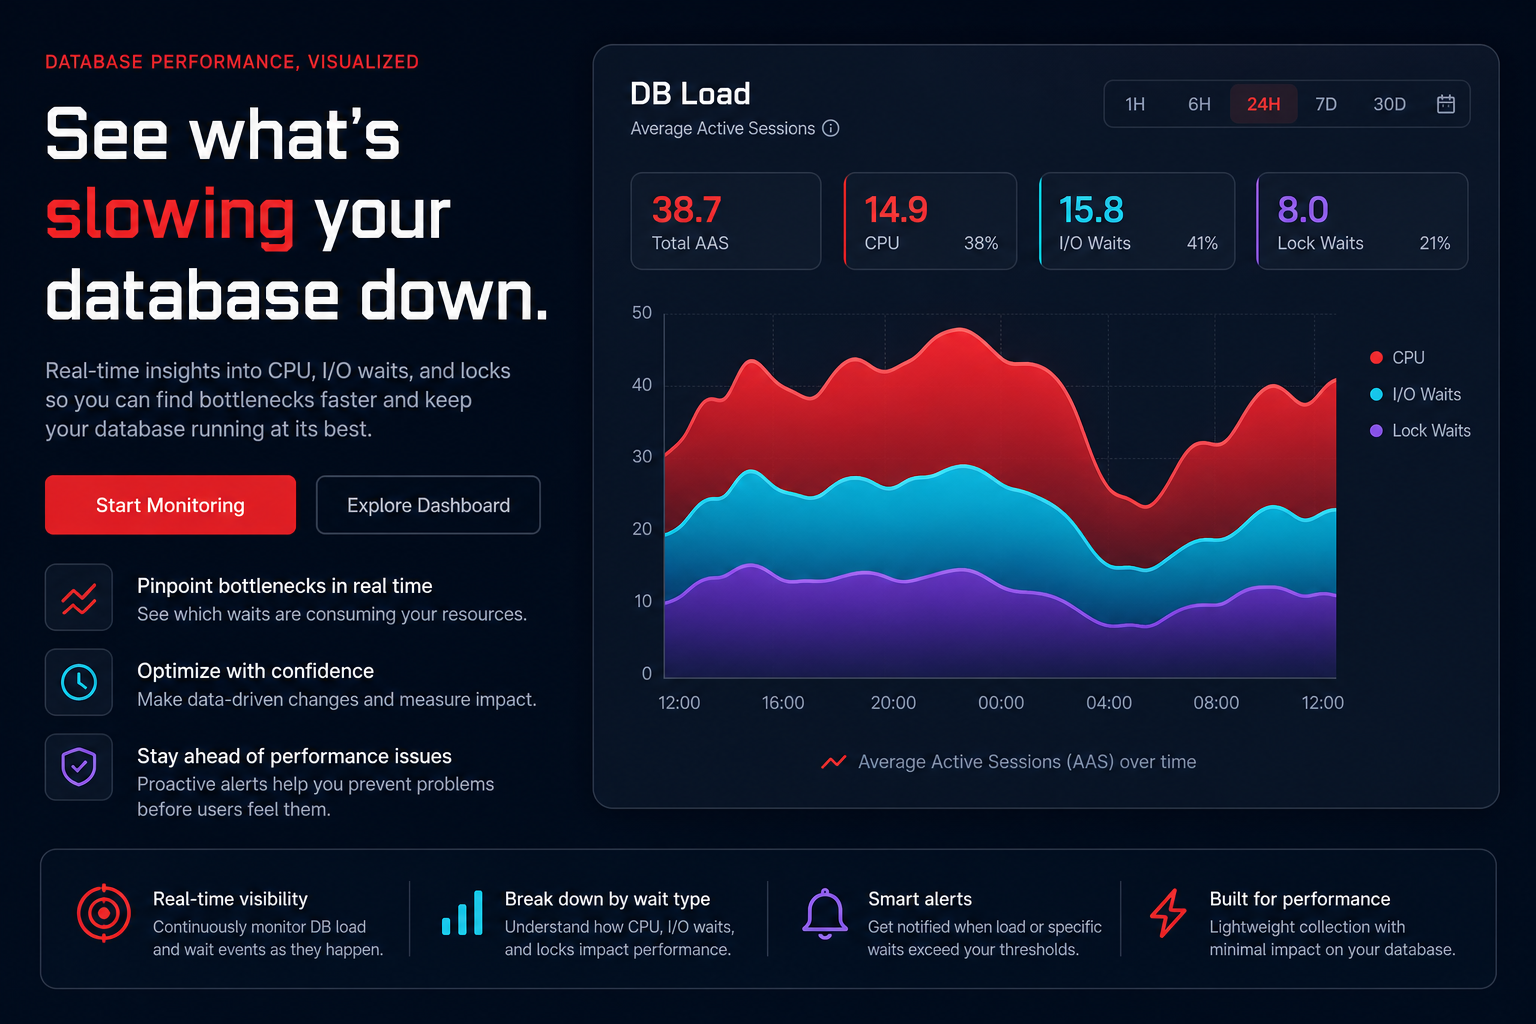
Database wait events and memory pressure
In RDS or Aurora environments, performance issues are rarely just about the instance size. You must monitor your `BufferCacheHitRatio`, which should ideally remain above 90%. If it drops, your database is likely reading from disk rather than memory, which increases latency by orders of magnitude. By using AWS Aurora performance tuning techniques, such as identifying query hotspots via Performance Insights, you can distinguish between a database that needs more RAM and one that simply needs better indexing or query optimization.
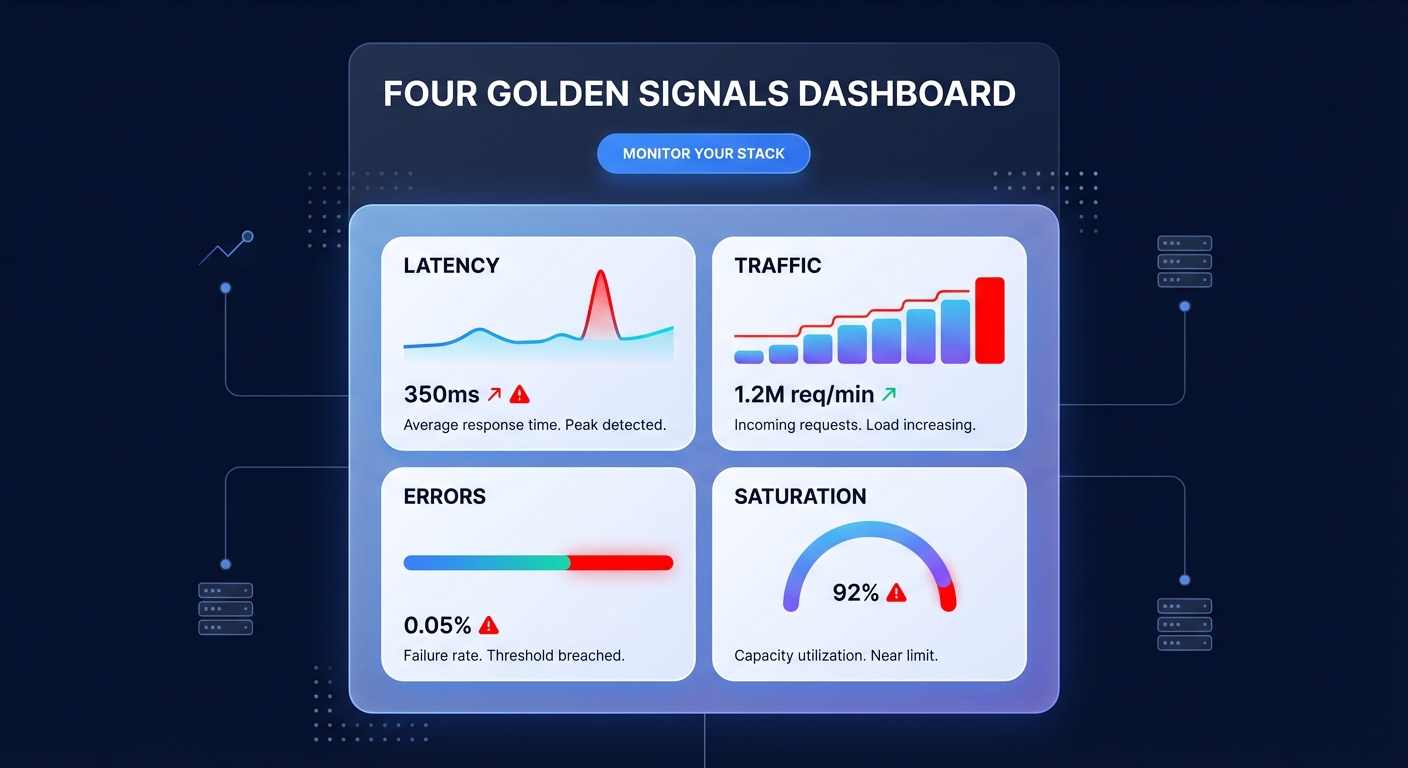
A systematic troubleshooting workflow
Diagnosing AWS issues requires moving from the high-level application layer down to the underlying infrastructure. Begin by evaluating the “Four Golden Signals” through AWS CloudWatch application monitoring. By tracking latency, traffic, errors, and saturation in a unified dashboard, you can quickly see if errors are spiking alongside latency, which usually points to code-level timeouts or downstream dependency failures.
Once you have identified the service at fault, isolate the infrastructure layer. Use distributed tracing to determine if the delay occurs in the API Gateway, a Lambda function, or the database call. This is also the time to implement AWS network performance monitoring to see if the lag is happening across Availability Zones or within the application stack itself. You should also verify your account-level Service Quotas, as hitting limits for concurrent Lambda executions or regional EC2 instance caps can cause silent throttling.
Finally, validate your storage performance. If storage is the suspected bottleneck, perform an EBS performance benchmark using industry-standard tools like `fio`. This helps you confirm if your volumes are delivering their provisioned performance or if you are hitting the maximum EBS bandwidth of your specific EC2 instance type. During this process, be mindful that increasing log verbosity for debugging can lead to an unexpected “observability bill spiral,” so monitor your CloudWatch logs pricing and set appropriate retention policies.
Fixing performance without blowing the budget
The “brute force” method of upgrading every instance to a larger family is a FinOps nightmare. Efficient troubleshooting should lead to right-sizing rather than just up-sizing. For example, if you find your workload is highly variable, migrating to Aurora Serverless v2 can provide the scaling needed for bursts without the cost of a permanently oversized primary instance.

When you have tuned your resources and established a predictable performance baseline, you can shift your focus to long-term efficiency. This is the ideal time to implement AWS Rate Optimization strategies. By using an algorithmic mix of Savings Plans and Reserved Instances to cover your steady-state resources, you can often achieve an Effective Savings Rate (ESR) of 50–70% on your compute workloads.
Put your AWS optimization on autopilot
Troubleshooting performance is a manual, high-stress task, but maintaining a cost-efficient infrastructure should not be. Most engineering teams leave up to 40% of their cloud budget on the table because they lack the time to continuously audit every resource for idle capacity or configuration mismatches. Hykell solves this by acting as your automated FinOps partner, identifying underutilized resources and executing automated cloud cost optimization while you focus on shipping features.
Hykell monitors your environment in real-time, performing deep audits to ensure your EBS volumes and EC2 instances are right-sized for your actual performance needs. We handle the complexities of rate optimization and infrastructure tuning on autopilot, requiring zero code changes from your engineering team. Because we operate on a performance-based model, we only take a slice of what you save – if you don’t save, you don’t pay.
Stop letting hidden inefficiencies drain your budget and slow down your application. Book a free AWS cost audit with Hykell today and see how much you could save while maintaining peak performance.